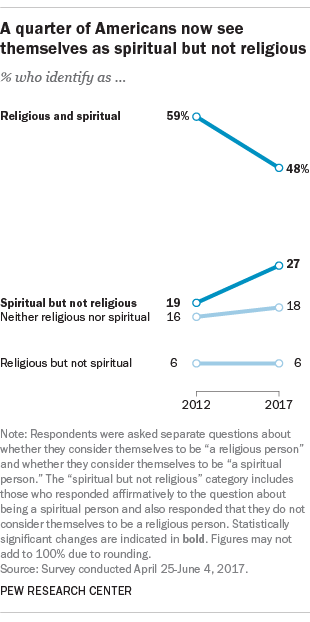
Some people may see the term “spiritual but not religious” as indecisive and devoid of substance. Others embrace it as an accurate way to describe themselves. What is beyond dispute, however, is that the label applies to a growing share of Americans.
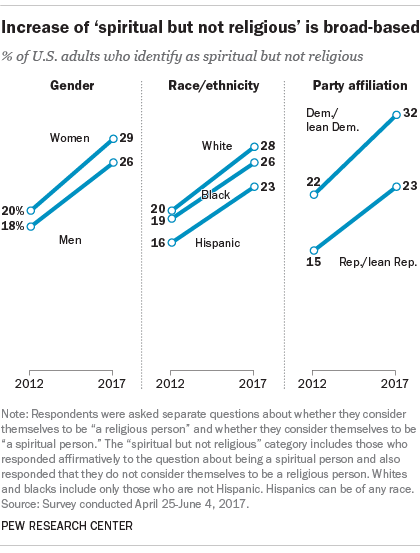
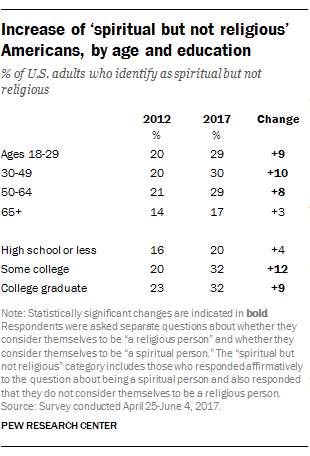
About a quarter of U.S. adults (27%) now say they think of themselves as spiritual but not religious, up 8 percentage points in five years, according to a Pew Research Center survey conducted between April 25 and June 4 of this year. This growth has been broad-based: It has occurred among men and women; whites, blacks and Hispanics; people of many different ages and education levels; and among Republicans and Democrats. For instance, the share of whites who identify as spiritual but not religious has grown by 8 percentage points in the past five years.
To be clear, the survey did not directly ask respondents whether the label “spiritual but not religious” describes them. Instead, it asked two separate questions: “Do you think of yourself as a religious person, or not?” and “Do you think of yourself as a spiritual person, or not?” The results presented here are the product of combining responses to those two questions.
In addition to those who say they are spiritual but not religious, 48% say they are both religious and spiritual, while 6% say they are religious but not spiritual. Another 18% answer both questions negatively, saying they are neither religious nor spiritual. Looked at another way, only 54% of U.S. adults think of themselves as religious – down 11 points since 2012 – while far more (75%) say they are spiritual, a figure that has remained relatively steady in recent years.
The growth of “spiritual but not religious” Americans has come mainly at the expense of those who say they are religious and spiritual. Indeed, the percentage of U.S. adults in this latter group has fallen by 11 points between 2012 and 2017.
A closer look
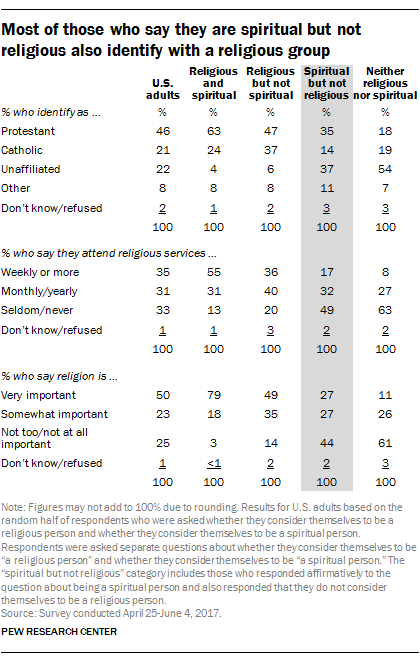
Who makes up this rapidly rising, “spiritual but not religious” segment of American adults? While many of them (37%) are religiously unaffiliated (describing their religious identity as atheist, agnostic or “nothing in particular”), most actually do identify with a religious group, including 35% who say they are Protestant, 14% who are Catholic and 11% who are members of others faiths, such as Judaism, Islam, Buddhism or Hinduism.
Many in the “spiritual but not religious” category have low levels of religious observance, saying they seldom or never attend religious services (49%, compared with 33% of the general public) and that religion is “not too” or “not at all” important in their lives (44% vs. 25% of all U.S. adults). But others in this group appear to be quite observant, at least by traditional measures – 17% say they attend religious services weekly, and 27% say religion is very important to them. In both cases, those who think of themselves as spiritual but not religious are more observant than those who say they are neither religious nor spiritual.
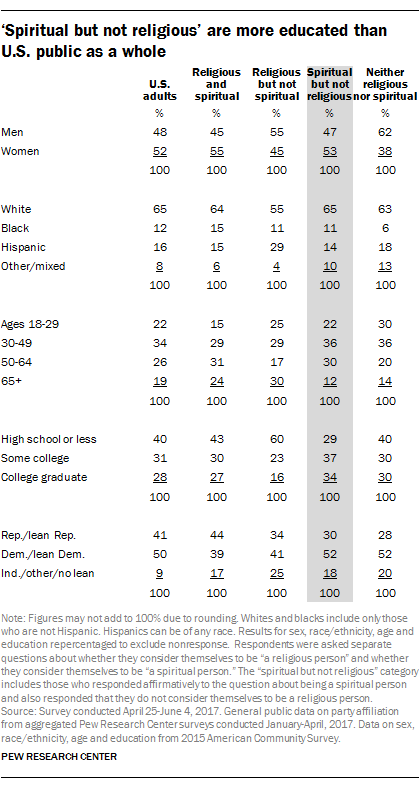
Those who are “spiritual but not religious” are about evenly split between men (47%) and women (53%) – in stark contrast with those who say they are neither religious nor spiritual, 62% of whom are men. Similarly, when it comes to race and ethnicity or age, those who are spiritual but not religious do not look dramatically different from the U.S. public overall, although they do skew a bit younger (for example, just 12% of these adults are ages 65 and older, compared with the 19% of all U.S. adults who are in this age group).
“Spiritual but not religious” Americans are more highly educated than the general public. Seven-in-ten (71%) have attended at least some college, including a third (34%) with college degrees. In addition, they lean Democratic, with 52% identifying with or leaning toward the Democratic Party, compared with 30% who identify as or lean Republican. Those who are neither religious nor spiritual also are more likely to be Democrats (52%). Compared with the spiritual but not religious, the share of Democrats among the religious and spiritual and the religious but not spiritual is lower, at 39% and 41%, respectively.
Note: See methodology and survey questionnaire here. (PDF)

