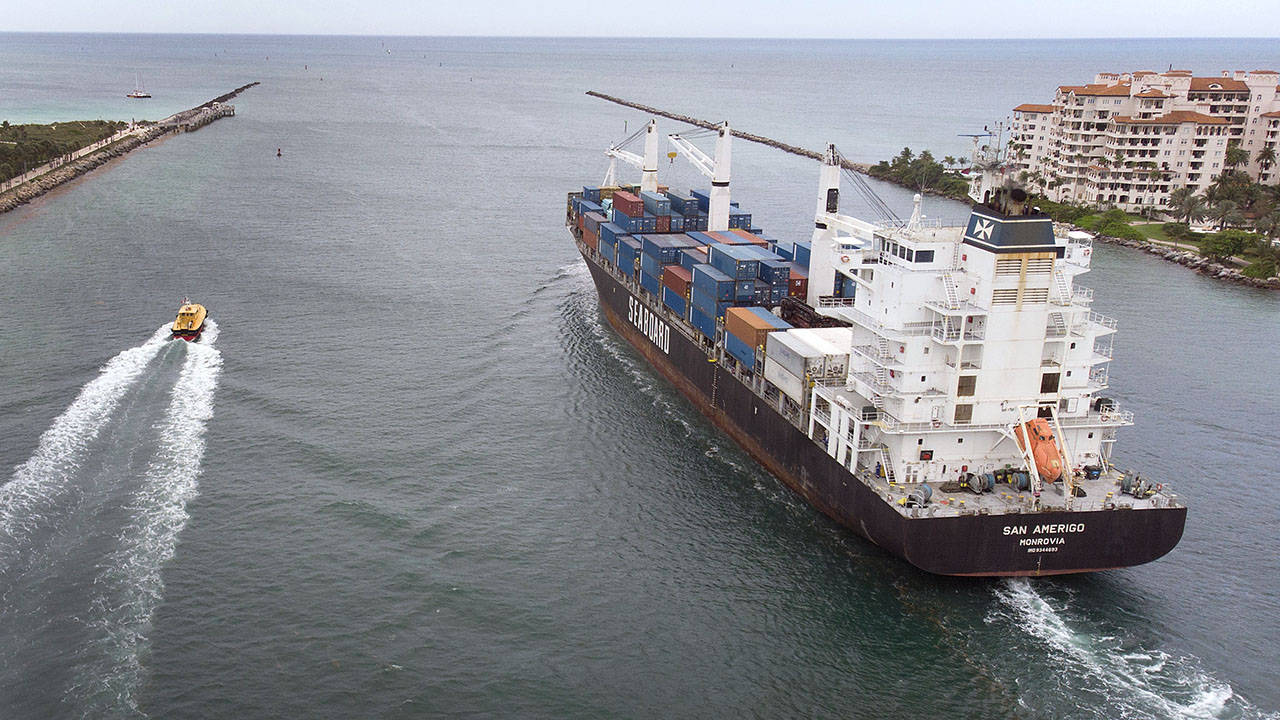

Think of a place that exports a lot and you might picture a bustling seaport, such as New York or the Los Angeles/Long Beach complex. But the most export-dependent places in the United States often are far from the big cities, and are much more likely to be in the South or the Midwest than on either coast, according to a Pew Research Center analysis of county-level data compiled by the Brookings Institution for its “Export Monitor” project.
Local economies that rely heavily on exports, in turn, have a lot at stake as multiple trade disputes play out between the U.S. and China, Mexico and other trading partners.

Measured as a share of gross domestic product, four sparsely populated parishes (Louisiana’s county equivalents) outside New Orleans are the most export-reliant localities in the country, according to the Center’s analysis. Those parishes are home to several giant oil and gas refineries and petrochemical plants, which account for the great majority of their exports. Taken together, exports from those parishes totaled more than $11 billion in 2017, or nearly two-thirds of their combined GDP.
The story is similar in Hancock County, Kentucky, outside Owensboro. The county, whose economy is dominated by aluminum smelters and aluminum products companies, exported $417 million in goods and services in 2017, or about 57% of its total GDP.
Sargent County, North Dakota, derives more than half of its $490.8 million GDP from exports. Machinery manufacturing drives the county’s export sector, led by a big Bobcat Company factory.
Meanwhile, Los Angeles County, the nation’s most populous county and home to its busiest port complex, exported $73.8 billion worth of goods and services in 2017 – the most of any county in the nation, but representing less than 10% of its total GDP.
Overall, exports represented 12.1% of U.S. GDP in 2017, according to the Bureau of Economic Analysis. Nearly half of the 3,114 counties and county equivalents in the Brookings dataset (1,533) were at or above that level.
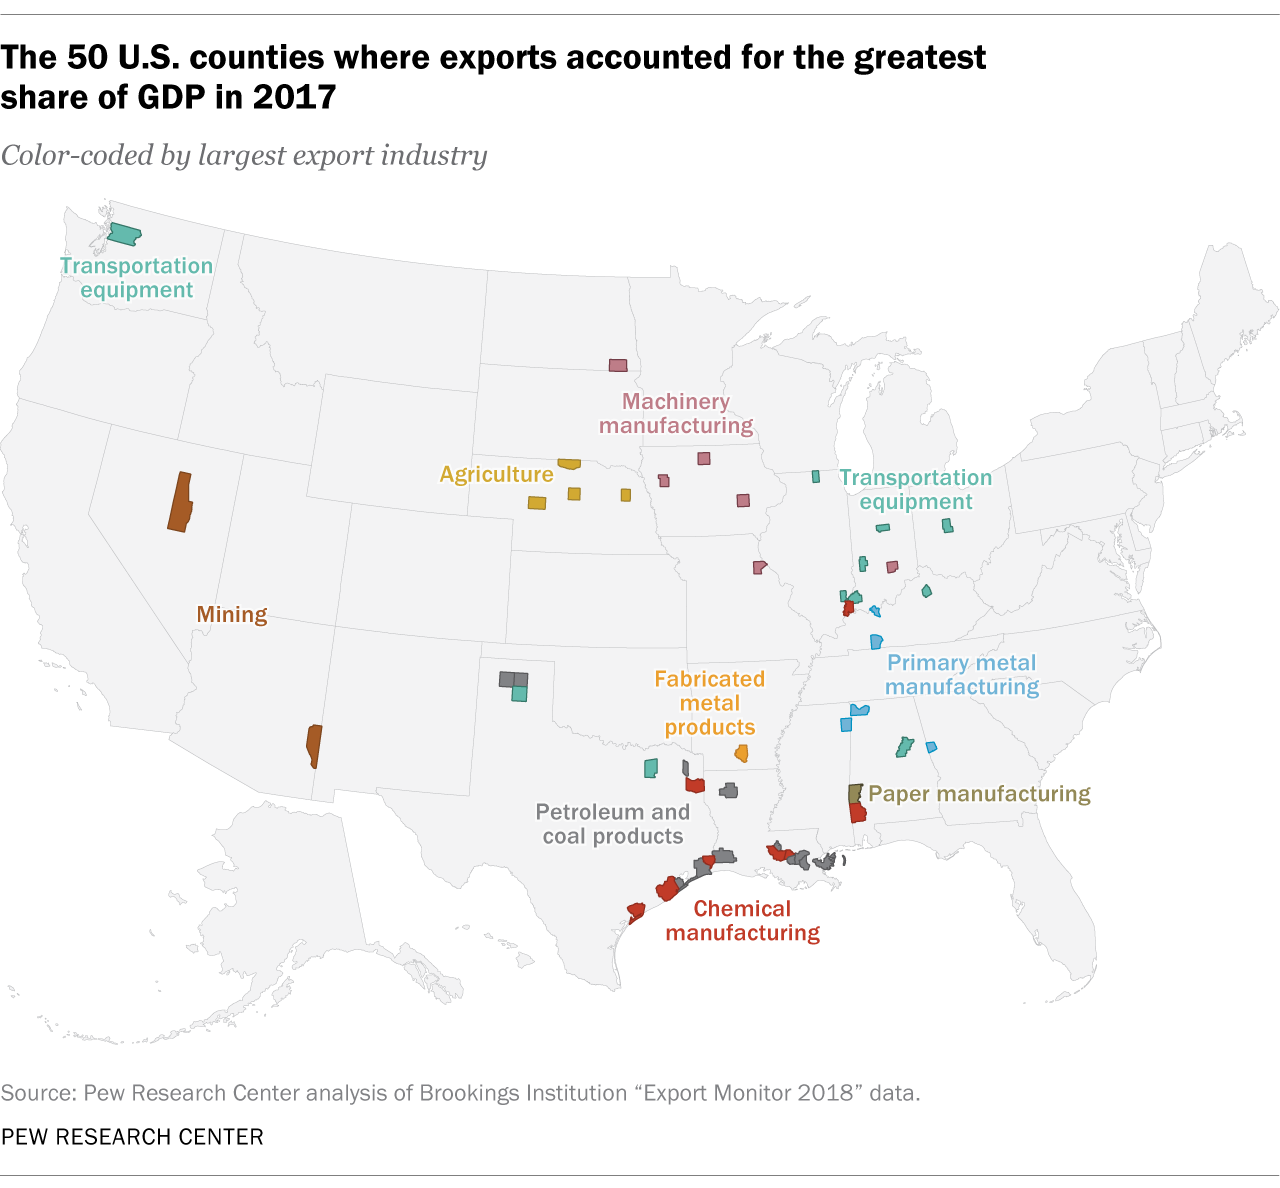
In general, the most export-dependent counties in the U.S. tend to be smaller, less economically diversified, and in the South and Midwest. Of the 50 counties whose exports represent the biggest share of local GDP, 30 are in the South (including 11 in Texas and nine in Louisiana), 17 are in the Midwest, and three are in western states. In fact, only one county in the Northeast – Fulton County, Pennsylvania, headquarters of construction equipment maker JLG Industries – derives as much as 30% of local GDP from exports.
A few populous counties are among the nation’s 50 most export-dependent. Snohomish County, Washington (just north of Seattle), site of an enormous Boeing aircraft assembly plant and home to more than 800,000 people, generated nearly $16 billion in exports in 2017, or more than a third (34%) of its total GDP.
But such places are more the exception than the rule: All but six of the 50 most export-dependent counties in 2017 had populations under 100,000. Three counties in Nebraska that together generated $96 million in exports (nearly all agricultural products), or almost 36% of their combined GDP, had a total population of just 1,892.
Nearly all of the nation’s most export-dependent counties rely on a single industry – or sometimes even a single plant – for the bulk of their exports. In all but eight of those 50 counties, a single industrial sector accounts for more than half of all exports. At the top is Eureka County, Nevada, a gold mining center: $464 million of its $469 million in 2017 total exports came from mining.

More typically, however, manufacturing is the dominant export sector. In 44 of the 50 most-export-dependent counties, the single biggest export generator is some form of manufacturing, with petroleum and coal products (12 counties) and transportation equipment (11 counties) most common.
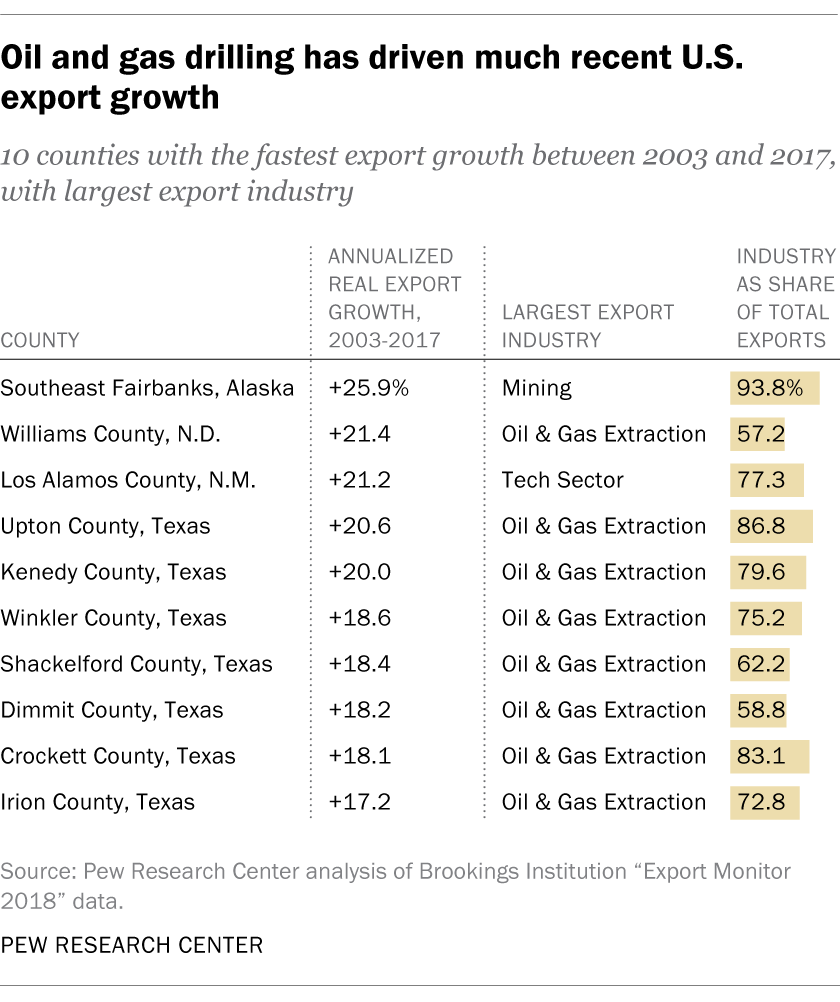
In the counties where exports have grown the fastest in recent years, one industry – oil and gas – has been overwhelmingly responsible. In 23 of the 30 counties with the highest real export growth rates between 2003 and 2017, oil and gas extraction was the single largest export source. Oil and gas accounted for more than half of all exports in 21 of those counties.
Note: This is an update of a post originally published Oct. 20, 2017.
Counties where exports made up highest share of GDP in 2017
| County | State | Population (2017) | Export share of GDP (2017) | Biggest export sector |
| St. James Parish | LA | 21324 | 67.7% | Petroleum & Coal Products |
| St. John the Baptist Parish | LA | 43339 | 62.1% | Petroleum & Coal Products |
| St. Bernard Parish | LA | 46108 | 62.1% | Petroleum & Coal Products |
| St. Charles Parish | LA | 52673 | 61.3% | Petroleum & Coal Products |
| Hancock County | KY | 8778 | 56.9% | Primary Metal Manufacturing |
| Iberville Parish | LA | 32920 | 51.8% | Chemical Manufacturing |
| Itawamba County | MS | 23512 | 51.8% | Primary Metal Manufacturing |
| Sargent County | ND | 3871 | 51.4% | Machinery Manufacturing |
| Posey County | IN | 25566 | 50.8% | Chemical Manufacturing |
| Bartholomew County | IN | 82429 | 46.4% | Machinery Manufacturing |
| Scott County | KY | 54790 | 46.3% | Transportation Equipment |
| Morris County | TX | 12381 | 46.1% | Petroleum & Coal Products |
| West Baton Rouge Parish | LA | 26207 | 45.3% | Petroleum & Coal Products |
| Jefferson County | TX | 256591 | 44.3% | Petroleum & Coal Products |
| Ralls County | MO | 10222 | 42.8% | Machinery Manufacturing |
| Hancock County | IA | 10773 | 42.5% | Machinery Manufacturing |
| Bienville Parish | LA | 13639 | 41.1% | Petroleum & Coal Products |
| Calhoun County | TX | 5224 | 41.0% | Chemical Manufacturing |
| Gibson County | IN | 33622 | 40.3% | Transportation Equipment |
| Edwards County | IL | 6471 | 39.7% | Transportation Equipment |
| Colbert County | AL | 54509 | 39.6% | Primary Metal Manufacturing |
| Hunt County | TX | 93927 | 39.4% | Transportation Equipment |
| Calcasieu Parish | LA | 202330 | 39.4% | Petroleum & Coal Products |
| Orange County | TX | 84936 | 39.2% | Chemical Manufacturing |
| Logan County | KY | 27014 | 38.9% | Primary Metal Manufacturing |
| Calhoun County | AR | 21770 | 38.9% | Fabricated Metal Products |
| Moore County | TX | 21878 | 38.0% | Petroleum & Coal Products |
| Iowa County | IA | 16118 | 37.6% | Machinery Manufacturing |
| Howard County | IN | 82311 | 37.2% | Transportation Equipment |
| Clay County | IN | 26155 | 37.1% | Transportation Equipment |
| Talladega County | AL | 80022 | 36.7% | Transportation Equipment |
| Loup County | NE | 605 | 36.7% | Agriculture |
| Hutchinson County | TX | 21362 | 36.5% | Petroleum & Coal Products |
| Eureka County | NV | 1950 | 36.1% | Mining |
| Galveston County | TX | 334304 | 36.0% | Petroleum & Coal Products |
| McPherson County | NE | 494 | 35.7% | Agriculture |
| Keya Paha County | NE | 793 | 35.2% | Agriculture |
| Washington County | AL | 16532 | 35.1% | Chemical Manufacturing |
| Ascension Parish | LA | 123028 | 35.0% | Chemical Manufacturing |
| Choctaw County | AL | 12935 | 34.8% | Paper Manufacturing |
| Snohomish County | WA | 803039 | 34.2% | Transportation Equipment |
| Brazoria County | TX | 362700 | 34.1% | Chemical Manufacturing |
| Carson County | TX | 6010 | 33.7% | Transportation Equipment |
| Ida County | IA | 6856 | 33.6% | Machinery Manufacturing |
| Boone County | IL | 53512 | 33.5% | Transportation Equipment |
| Union County | OH | 56797 | 33.5% | Transportation Equipment |
| Heard County | GA | 11759 | 33.4% | Primary Metal Manufacturing |
| Greenlee County | AZ | 9468 | 33.3% | Mining |
| Harrison County | TX | 66540 | 32.8% | Chemical Manufacturing |
| Stanton County | NE | 5977 | 32.8% | Agriculture |
