Attitudes about same-sex marriage vary widely around the world, according to several Pew Research Center surveys fielded in 32 places in the last two years. Among the surveyed publics, support for legal same-sex marriage is highest in Sweden, where 92% of adults favor it, and lowest in Nigeria, where only 2% back it.
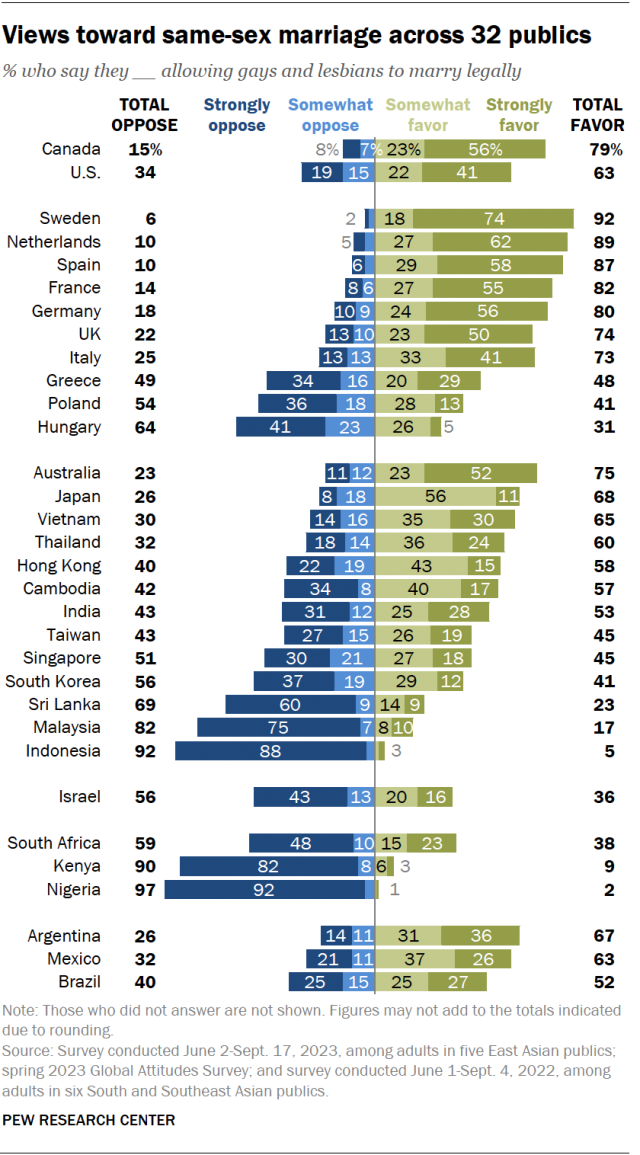
In the United States, where the Supreme Court legalized same-sex marriage nationally in 2015, 63% of adults support it and 34% oppose it. But views are highly fractured along political and demographic lines.
For example, Democrats and independents who lean toward the Democratic Party are nearly twice as likely as Republicans and Republican leaners to support same-sex marriage rights (82% vs. 44%). Similarly, nearly three-quarters (73%) of Americans under the age of 40 say they favor allowing gays and lesbians to marry legally – 16 percentage points higher than the share of Americans 40 and older who agree (57%).
Related: In places where same-sex marriages are legal, they account for a small share of all marriages
Below is a closer look at how attitudes about same-sex marriage differ around the world, based on our surveys. This analysis looks at how attitudes vary by geography, demographic factors, political ideology and religion, as well as how views have changed over time.
This Pew Research Center analysis focuses on public opinion of the legality of same-sex marriage in 32 places in North America, Europe, the Middle East, Latin America, Africa and the Asia-Pacific region. This is the first year since 2019 that the Global Attitudes Survey has included publics from Africa and Latin America, which were not included more recently due to the coronavirus outbreak.
For non-U.S. data, this analysis draws from three nationally representative surveys conducted across 31 publics. In 21 publics, we conducted a survey of 24,546 adults from Feb. 20 to May 22, 2023. All interviews were conducted over the phone in Canada, France, Germany, Greece, Italy, the Netherlands, Spain, Sweden and the United Kingdom. Interviews were conducted face-to-face in Hungary, Poland, India, Indonesia, Israel, Kenya, Nigeria, South Africa, Argentina, Brazil and Mexico. In Australia, we used a mixed-mode probability-based online panel.
Data for Hong Kong, Japan, South Korea, Taiwan and Vietnam draws on another survey of 10,390 adults conducted in five Asian publics from June 2 to Sept. 17, 2023. All interviews in Hong Kong, Japan, South Korea and Taiwan were conducted over the phone. Interviews were conducted face-to-face in Vietnam.
Data for Cambodia, Malaysia, Singapore, Sri Lanka and Thailand draws on a third survey of 10,551 adults conducted in five South and Southeast Asian publics from June 1 to Sept. 4, 2022. All interviews in Malaysia and Singapore were conducted over the phone. Interviews were conducted face-to-face in Cambodia, Sri Lanka and Thailand. Both the survey in East Asia and the one in South and Southeast Asia are part of the Pew-Templeton Global Religious Futures project, which analyzes religious change and its impact on societies around the world.
In the United States, we surveyed 3,576 U.S. adults from March 20 to 26, 2023. Everyone who took part in this survey is a member of the Center’s American Trends Panel (ATP), an online survey panel that is recruited through national, random sampling of residential addresses. This way nearly all U.S. adults have a chance of selection. Read more about the ATP’s methodology.
Respondents for all surveys were selected using probability-based sample designs. In Thailand, we conducted additional interviews in the Southern region, which has larger shares who are Muslim. The data in all publics is weighted to account for different probabilities of selection among respondents and to align with demographic benchmarks for adult populations.
This post is an update of one published June 13, 2023. This new post includes more publics surveyed. It also uses a different rounding procedure to generate the “total” figures, so results may differ slightly from previously published estimates. The accompanying topline figures are unchanged.
Here are the questions used for the analysis, along with responses, and the survey methodology.
How attitudes about same-sex marriage vary geographically
Europe
People in Western Europe stand out as staunch supporters of same-sex marriage. At least eight-in-ten adults support it in Sweden (92%), the Netherlands (89%), Spain (87%), France (82%) and Germany (80%). In each of these places, the practice is legal.
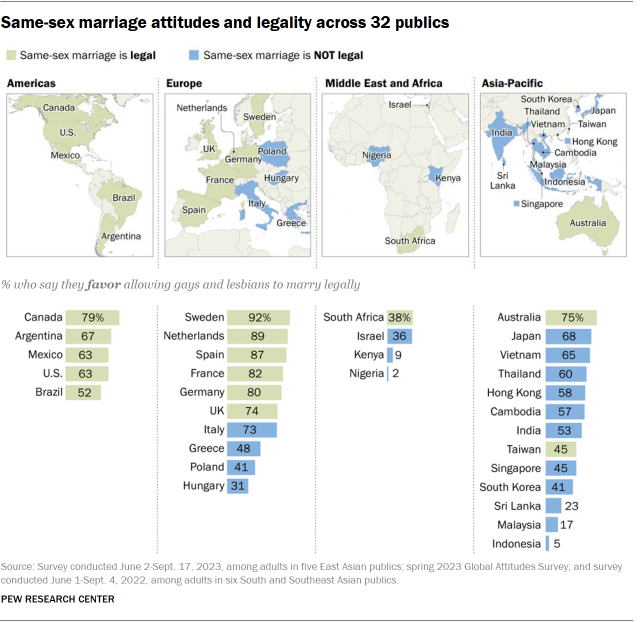
In Italy, where issues of LGBTQ+ rights have been in the headlines, 73% of adults favor same-sex marriage rights, though it is not legal there.
Around three-quarters (74%) of adults in the United Kingdom also support same-sex marriage. The practice is legal in England, Wales, Scotland and Northern Ireland, although those laws were approved at various times over the past decade.
At the other end of the spectrum in Europe, just 41% of adults in Poland and 31% in Hungary support same-sex marriage. In both places, same-sex marriage is not legal, and LGBTQ+ rights are a political and social flashpoint.
Americas
In North America, around eight-in-ten Canadians (79%) support same-sex marriage, as do 63% in both the U.S. and Mexico. Same-sex marriage is legal in all three places.
Related: About six-in-ten Americans say legalization of same-sex marriage is good for society
In South America, 67% of Argentines and 52% of Brazilians support the right of gay and lesbian people to marry. Both places have also legalized the practice.
Asia-Pacific
In the Asia-Pacific region, support for same-sex marriage is highest in Australia and Japan. Three-quarters of adults in Australia and nearly seven-in-ten (68%) in Japan favor legal same-sex marriage. But while many Australians who favor same-sex marriage say they strongly support it (52%), support is weaker in Japan, where a 56% majority somewhat favor legal same-sex marriage. Australia has legalized same-sex marriage, but Japan has not.
Views toward legalizing same-sex marriage are similarly favorable in Vietnam, where 65% say they support it.
In India, 53% of adults say same-sex marriage should be legal, while 43% oppose it. The Indian Supreme Court recently rejected a petition to legalize same-sex marriage. (The survey there was conducted prior to the ruling.)
And in Taiwan, roughly equal shares say they support (45%) and oppose (43%) same-sex marriage, with the remainder providing no answer. Taiwan is the only place in Asia where same-sex marriage is legal.
In South Korea, same-sex marriage is not legal, though some lawmakers have proposed changing this. Among South Koreans, 41% favor legal same-sex marriage and 56% oppose it.
Indonesians are highly opposed to same-sex marriage legalization. Roughly nine-in-ten (92%) oppose allowing gays and lesbians to marry, including 88% who say they strongly oppose it. Just 5% of Indonesians support same-sex marriage.
Related: Asian views of same-sex marriage
Africa and Middle East
South Africa remains the only place in Africa where same-sex marriage is legal, having codified it in 2006. Nevertheless, 59% of South Africans oppose the practice.
Nigerians and Kenyans are the least supportive of same-sex marriage rights among the places in Africa surveyed. In Nigeria, where homosexuality is illegal, only 2% of adults say they support allowing gays and lesbians to marry. And in Kenya, just 9% favor it.
In the Middle East, 56% of Israelis are also opposed to making same-sex marriage legal. Religious affiliation and political leanings heavily shape views of same-sex marriage rights in Israel.
How attitudes about same-sex marriage vary by demographic factors
Age
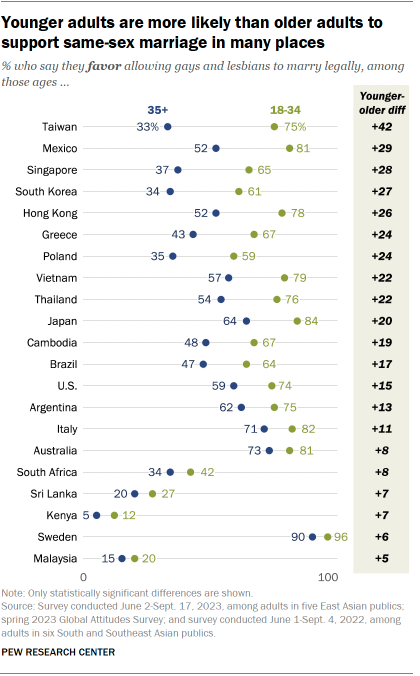
In 21 of the places surveyed, adults under the age of 35 are more likely than their older counterparts to say they favor allowing gays and lesbians to marry legally. And in some places, older adults are less likely to provide a response than younger adults.
The age gap is greatest in Taiwan. Three-quarters of Taiwanese adults under 35 express support for same-sex marriage, compared with roughly a third of those 35 and older.
Gender
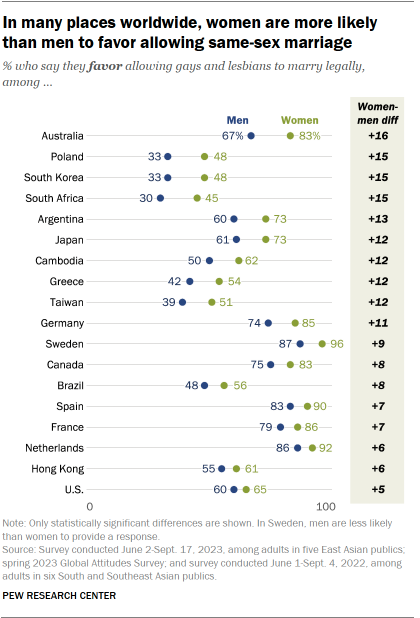
In 19 of the surveyed places, women are more likely than men to say they support allowing gays and lesbians to marry legally.
For example, in Australia, 83% of women favor it, compared with 67% of men.
There are similar gender differences in Argentina, Cambodia, Germany, Greece, Japan, Poland, South Africa, South Korea, Sri Lanka and Taiwan.
Education and income
In 22 of the surveyed places, people with more education are more likely than those with less education to support allowing gays and lesbians to marry. In some places, those with less education are less likely to provide a response than those with more education.
Similarly, in 10 places, people with incomes over the national average are more likely than those with incomes at or below the median to support same-sex marriage. In one of these places – Poland – those with lower incomes were less likely to provide a response.
How attitudes about same-sex marriage vary by political ideology
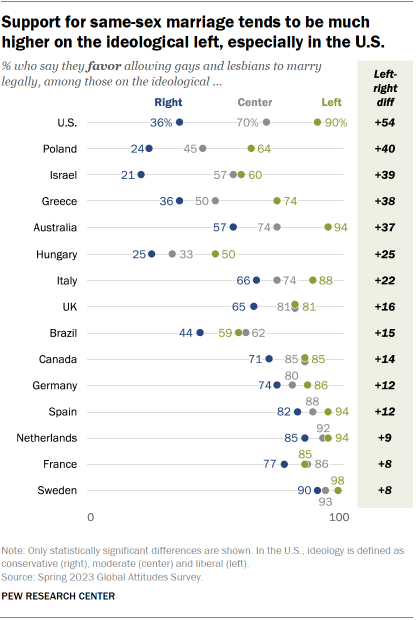
Views on same-sex marriage are related to political ideology in 15 of the 18 places where we asked about respondents’ ideology this year. In these places, those on the ideological left are significantly more likely than those on the right to favor allowing gays and lesbians to marry legally.
The ideological difference is greatest in the U.S., where liberals are 54 points more likely than conservatives to support same-sex marriage (90% vs. 36%). Still, in nine surveyed places, majorities of those on both the right and left say they support same-sex marriage.
How attitudes about same-sex marriage vary by religion
Support for legal same-sex marriage tends to be lower in places where more people say religion is somewhat or very important in their lives. Support is higher in places where fewer people consider religion important.
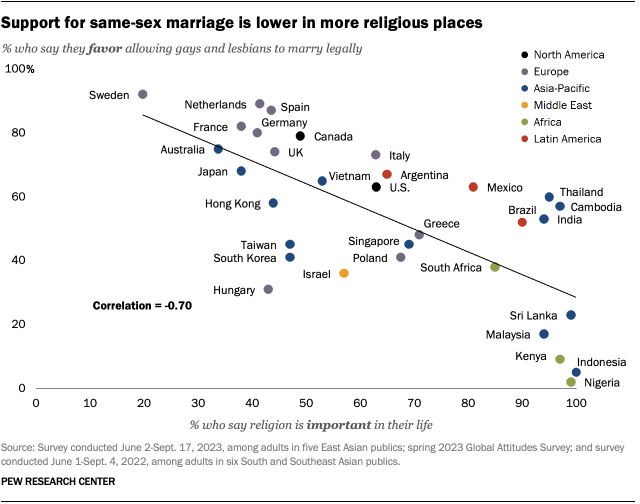
In Nigeria, 99% of adults say religion is at least somewhat important in their lives and only 2% favor legal same-sex marriage. In Indonesia, where 100% of Indonesians say religion is important to them, 5% support legal same-sex marriage. In Sweden, by comparison, just 20% of adults consider religion important to them – and 92% favor allowing gay and lesbian people to wed.
Similarly, people who are not affiliated with a religion are much more likely to say they support same-sex marriage. In Australia, for example, 89% of religiously unaffiliated adults say they favor same-sex marriage, compared with 64% of adults with a religious affiliation.
Together, the most recent surveys show some additional patterns by religion:
- Religiously unaffiliated Americans (85%) – especially atheists (96%) – are the most likely to favor same-sex marriage legality. White, non-Hispanic evangelical Protestants are the least likely religious group to say they favor it (30%). Around two-thirds of U.S. Catholics (65%) favor same-sex marriage, as do 70% of White nonevangelical Protestants.
- In Brazil, Catholics (56%) are more likely than Protestants (32%) to support same-sex marriage.
- In Israel, Jewish adults (41%) are more likely than Muslims (8%) to support same-sex marriage. Among Israeli Jews, 4% of those who are Haredi (“ultra-Orthodox”) or Dati (“religious”) support legal same-sex marriage, compared with 29% of Masorti (“traditional”) Jews. Around three-quarters of Hiloni (“secular”) Jews support this policy.
- In Nigeria, Christians and Muslims are equally likely to oppose same-sex marriage (97% and 98%, respectively).
How attitudes about same-sex marriage have changed over time
It is difficult to directly compare these new survey findings with past surveys on whether people favor or oppose same-sex marriage. Earlier Center surveys focused more on religion and its influence in society, rather than political attitudes and international affairs. And in some places, the mode of the survey (e.g., face-to-face vs. phone vs. web) has changed over time.
However, a comparison with surveys conducted in Latin America in 2013-14, in Europe in 2015-17, and the long-term trend in the U.S. generally shows increased public support for the legalization of same-sex marriage over the past decade.
Note: This is an update of a post originally published June 13, 2023. Here are the questions used for the analysis, along with responses, and the survey methodology.


