Americans continue to express positive views of several departments and agencies of the federal government. But there are partisan differences in many of these attitudes.
Most of these partisan gaps are similar to those seen last year, but Republicans and Democrats have grown further apart in their opinions of the Department of Justice. Republicans’ evaluations of the department have turned more negative.
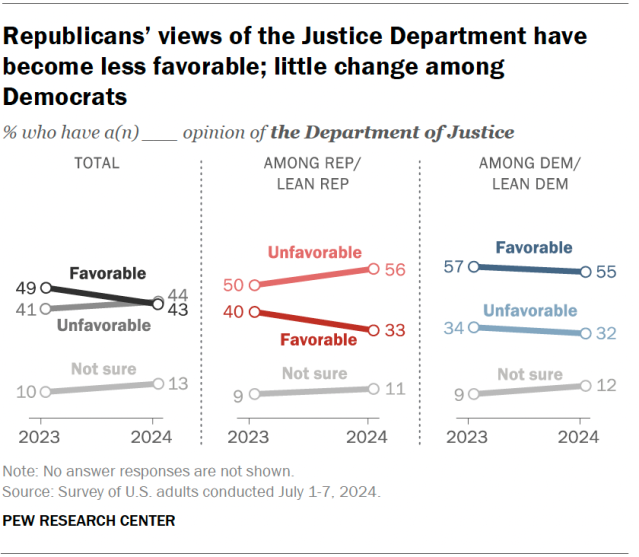
Today, a majority of Republicans and Republican-leaning independents (56%) say they have an unfavorable opinion of the Justice Department, up from 50% last year. A third have a favorable opinion of the DOJ, while 11% say they are not sure.
By contrast, 55% of Democrats and Democratic leaners have a favorable impression of the DOJ. About a third of Democrats (32%) say they have an unfavorable opinion and 12% are not sure. Views among Democrats are similar to those measured a year ago.
Republicans’ evaluations of the Department of Homeland Security have also turned more negative over the last year: 41% now have a favorable view, down from 47% in 2023.
Pew Research Center regularly conducts surveys to gauge the public’s attitudes about the federal government, including government agencies and departments. For this analysis, we surveyed 9,424 adults from July 1 to 7, 2024.
Everyone who took part in this survey is a member of the Center’s American Trends Panel (ATP), a group of people recruited through national, random sampling of residential addresses who have agreed to take surveys regularly. This kind of recruitment gives nearly all U.S. adults a chance of selection. Surveys were conducted either online or by telephone with a live interviewer. The survey is weighted to be representative of the U.S. adult population by gender, race, ethnicity, partisan affiliation, education and other factors. Read more about the ATP’s methodology.
Here are the questions used for this analysis, the topline and the survey methodology.
Many federal agencies are viewed positively overall
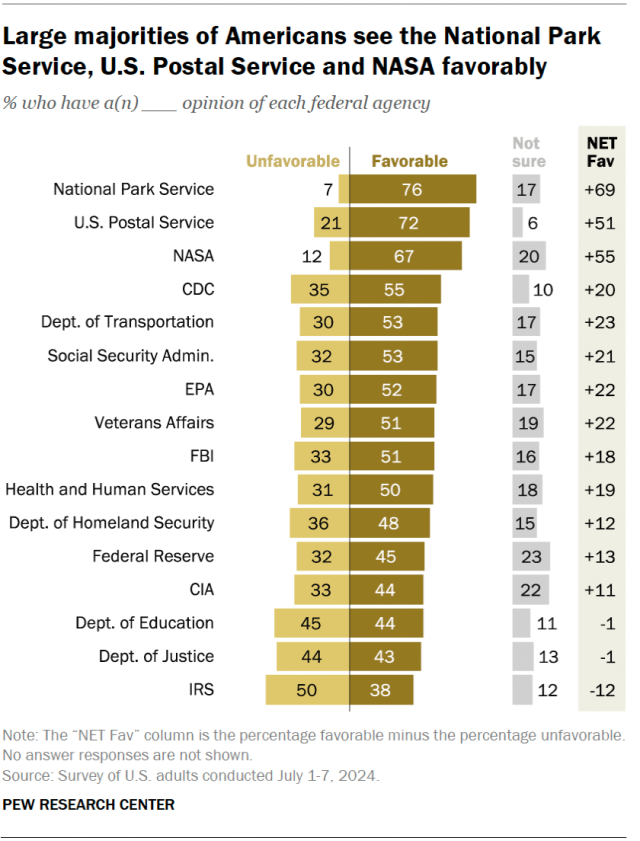
On balance, Americans view 13 of 16 federal agencies we asked about more favorably than unfavorably, according to our survey of 9,424 adults conducted July 1-7. Of those 13 agencies, 10 have net favorable ratings of 15 percentage points or more.
Topping the list are the National Park Service (76% favorable), the U.S. Postal Service (72%) and NASA (67%).
Smaller majorities have favorable impressions of other agencies, including the Centers for Disease Control and Prevention (55% favorable), the Department of Transportation (53%) and the Social Security Administration (53%).
Americans have mixed views of the Department of Education (44% favorable, 45% unfavorable, 11% unsure) and the Department of Justice (43% favorable, 44% unfavorable, 13% unsure).
The least popular federal agency of the 16 asked about is the Internal Revenue Service. Half of Americans have an unfavorable opinion of the IRS, while 38% have a favorable view.
The agencies that are viewed favorably in our recent online surveys were also among the most favorably viewed in past Pew Research Center surveys conducted by telephone. However, because of differences in question wording and survey mode, the specific percentages in recent web surveys and past telephone surveys are not directly comparable. (Refer to the drop-down box below for more.)
This survey is the second time Pew Research Center has measured the public’s attitudes about federal government agencies on our online American Trends Panel. We previously did so in 2023. Earlier surveys measuring views of federal agencies, including polls fielded in 2020 and in 2019, were conducted by telephone.
The findings in our 2024 and 2023 web surveys are not directly comparable with those past telephone surveys for two reasons:
- The web surveys use different question wording than past telephone surveys. Online survey respondents receive an explicit “not sure” response option. Telephone respondents, by contrast, had to volunteer that they did not have an opinion about an agency. This change generally results in a larger share of respondents declining to offer an opinion.
- Surveys conducted online and by telephone often produce different results because respondents sometimes answer similar questions differently across modes. This is called a “mode effect.”
These two factors mean that point estimates (for instance, the share of respondents who express a favorable opinion about a single agency in our new survey and in a prior phone survey) should not be directly compared to measure change over time. Doing so would conflate question wording and mode differences with change over time.
Despite this limitation, some broad comparisons can be made. For example, if a wide partisan gap is evident for one agency that was not apparent in past surveys – whereas the partisan gap has remained relatively stable for other agencies – that change is likely not only a result of the transition to online polling from phone polling.
Republicans have mostly negative views of CDC, Department of Education
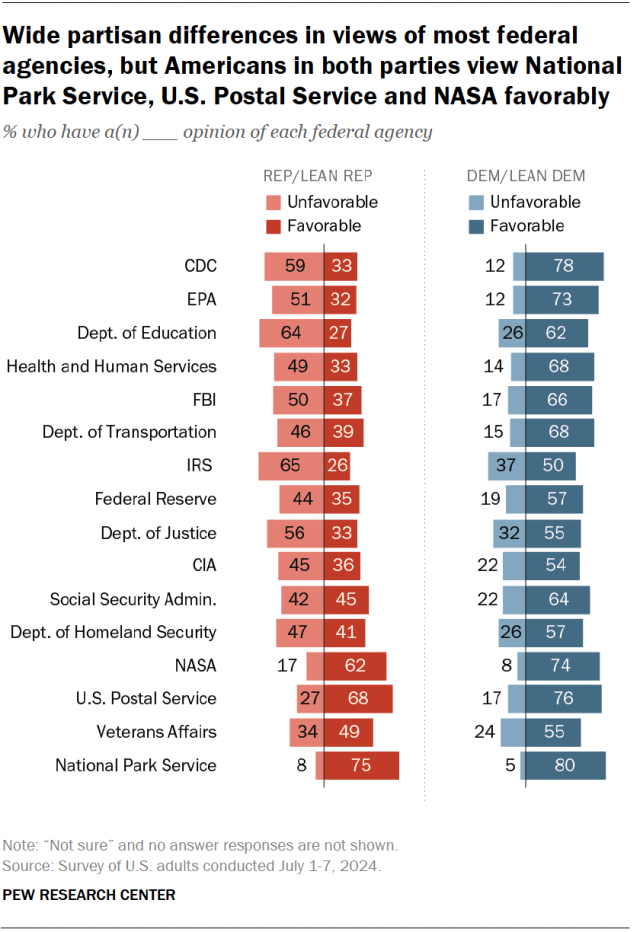
There are wide partisan gaps in Americans’ views of several federal agencies.
Democrats and Democratic leaners hold consistently favorable views of all 16 agencies asked about.
Republicans and GOP leaners express more unfavorable than favorable views for 11 of the 16 agencies.
The partisan divisions in favorability are deepest for the Centers for Disease Control and Prevention (78% favorable among Democrats vs. 33% among Republicans) and the Environmental Protection Agency (73% vs. 32%).
There are also wide partisan gaps over the Department of Health and Human Services, the Department of Education, the FBI, the Department of Transportation, the IRS and other agencies.
In contrast, clear majorities of both Democrats and Republicans give positive ratings to the National Park Service (80% vs. 75%, respectively), the U.S. Postal Service (76% vs. 68%) and NASA (74% vs. 62%).
Among Democrats, the CDC and EPA receive some of the highest net favorability ratings
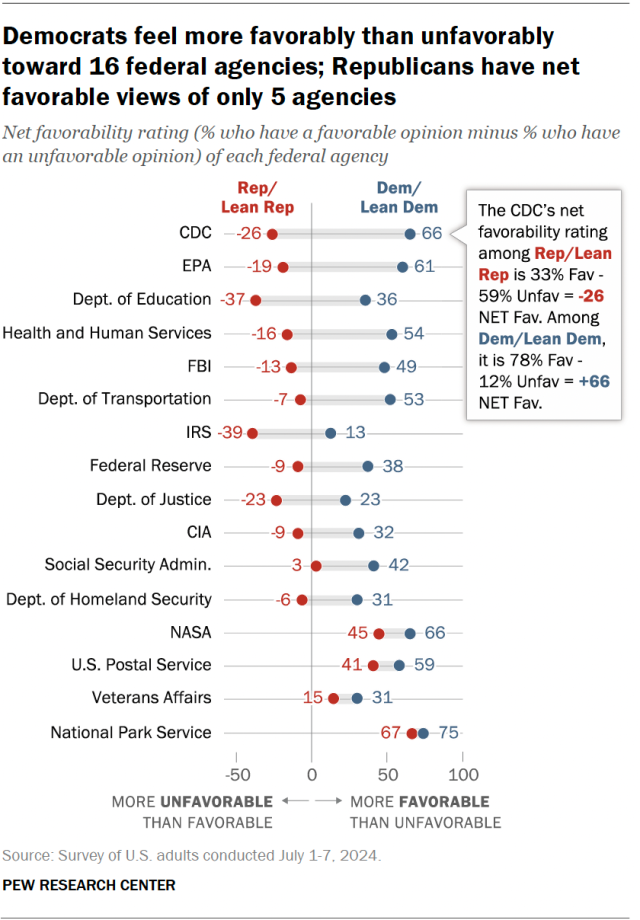
A large majority of Democrats (78%) rate the CDC favorably, while just 12% see the agency unfavorably. That amounts to a 66-point net advantage for the CDC.
For the EPA, 73% of Democrats see the agency favorably – 61 points more than the share who see it unfavorably.
Democrats view the IRS least favorably of the 16 federal agencies. They are only 13 points more likely to view it favorably than unfavorably (50% vs. 37%).
Republicans are much less favorable than Democrats toward most agencies
The agencies that Republicans feel most favorably toward are the National Park Service (67-point net favorability), NASA (45 points) and the Postal Service (41 points).
While it is not possible to make direct percentage point comparisons to past surveys due to a shift in survey mode, Republicans are more likely today than in the past to have substantially more negative than positive views of several agencies.
Republicans’ negative opinions of the CDC, in particular, appear to reflect a shift related to the coronavirus pandemic. Past Center surveys showed that Republicans were especially critical of the CDC’s handling of the outbreak.
Note: This is an update of a post originally published March 30, 2023. Here are the questions used for this analysis, the topline and the survey methodology.
