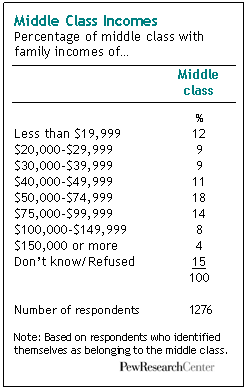
“Middle class” is a term that is universally familiar but devilishly difficult to pin down. It is both a social and economic construct, and because these domains don’t always align, its borders are fuzzy. Is a $30,000-a-year resident in brain surgery lower class? Is a $100,000-a-year plumber upper-middle class? One way to sidestep riddles of this sort is to ask people to label themselves. That’s what we did in a telephone survey of a nationally representative sample of 2,413 adults last year.1 It produced a straightforward-seeming result: about half (53%) of all adults in America say they are middle class; and the median annual family income of this group of respondents is $52,285.

But beyond the simplicity of these numbers lies a nest of anomalies. For example, about four-in-ten (41%) adults with $100,000 or more in annual household income say they are middle class. So do nearly half (46%) of those whose household incomes are below $40,000. As for those in between, about a third say they’re not in the middle class.
In short, when it comes to self-identifying as middle class, different groups of Americans use different yardsticks. Some cases in point: younger adults and older adults are both more likely than middle-aged adults to describe themselves as middle class, even though, on average, their income levels are lower. Meantime, middle-aged middle-class adults are more likely than those who are younger and older to report financial stresses, even though they have more income. Also, roughly the same percentages of whites (53%), blacks (50%) and Hispanics (54%) self-identify as middle class, despite the fact that the income and wealth of blacks and Hispanics who say they are middle class is much lower than that of whites who say they are middle class. Clearly, declaring oneself to be middle class is more than a statement about income and assets. It’s also a state of mind.

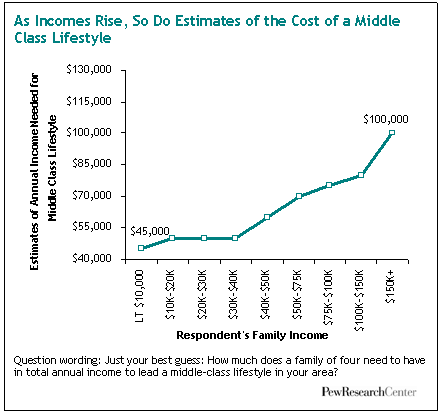
Along these same lines, when survey respondents are asked how much money they think it takes for a family of four to lead a “middle-class lifestyle” in their area, their answers array along a sliding scale that correlates with their income. The greater the income, the higher the estimate. Thus, adults in families whose income is between $100,000 and $150,000 a year believe, on average, that it takes $80,000 to live a middle-class life in their area. By contrast, adults in families whose income is less than $30,000 a year believe that a middle-class lifestyle can be had for about $50,000 a year. Analyzing these estimates by the ZIP codes of the respondents yields a similar finding: people who live in communities with a high cost of living think it takes, on average, about $15,000 more to be in the middle class than do people who live in communities with a low cost of living.

The bottom line is that while about half the country considers itself middle class, their judgments are influenced by the laws of relativity. Bearing this in mind, our report undertook a parallel analysis of what it means to be middle class — this one driven by economic and demographic data rather than by self-definition. Using Census figures, we divided Americans into three income tiers — low, middle and high. We defined the middle income tier as consisting of adults who live in a household where the annual income falls within 75% to 150% of the national median, a common set of boundaries for analyses of income dispersion.2
This analytical frame enabled us to examine how the middle income tier has changed over time in its size, demographic traits and standard of living. Has it gotten smaller or larger since 1970? How has it fared economically — both in absolute terms, and relative to the income tiers below and above? Also, by lining up these Census-based trends alongside our survey results, we were able to make some judgments about how well public perceptions square with the underlying economic realities.


