The period of 2005 to 2009 was marked by a series of tumultuous economic developments. A bubble in the housing market burst in 2006, triggering the Great Recession in 2007 and a stock market collapse in 2007-2008. Each of these events was historic in its magnitude, and it is not surprising that household wealth would shrink under their collective weight. This section of the report provides background on the major economic trends that created the context for the sharp erosion of household wealth from 2005 to 2009.3
The Housing Market

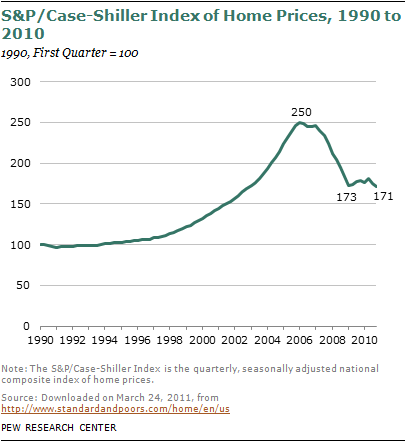
The sharp increase in housing prices that characterized the real estate bubble can be traced to the middle of the 1990s. At the time, the U.S. economy was in the midst of the longest economic expansion on record, from March 1991 to March 2001. After remaining flat for the first half of the 1990s, home prices, as measured by the S&P/Case-Shiller Index, rose 29% from the first quarter of 1995 to the first quarter of 2000.
For housing prices, the latter half of the 1990s would prove to be only the prelude. In the space of the next six years home prices nearly doubled, increasing 89% from the first quarter of 2000 to the first quarter of 2006. However, the clock then rewound quickly. By the first quarter of 2009, home prices had fallen 31%. And since then, they have remained flat.
The 2006 peak in home prices and the subsequent trough in 2009 roughly coincide with the dates of the wealth estimates reported in this study. In particular, the 2005 wealth data were collected from September to December 2005, and the 2009 wealth data were collected from August to November 2009 (see the appendix for details). Thus, the wealth estimates in this report, and the estimated changes from 2005 to 2009, capture the brunt of the housing downturn.
The rise of the housing bubble and its deflation were not evenly distributed across the country or across demographic groups. The run-up in home prices was among the steepest in California, Arizona, Nevada and Florida, and so was the run-down. For example, according to the S&P/Case-Shiller Index, home prices rose 168% in the Miami metropolitan area from January 2000 to January 2006. But they fell 45% from January 2006 to December 2009. Some other states, such as Michigan, have suffered sharp losses in house prices since 2006 even though they did not experience much of a run-up during the bubble years. (In the case of Michigan, the main culprit has been job losses caused by the manufacturing downturn.)
Another facet of the housing meltdown is the rise in foreclosure rates. According to RealtyTrac©, the number of homes in the U.S. with at least one foreclosure filing increased from 0.6% in 2006 to 2.2% in 2010. The rates were much higher in some states: Nevada (9.4%); Arizona (5.7%); Florida (5.5%); and California (4.1%). Research also suggests that Hispanics and blacks were twice as likely as whites to experience foreclosures from 2007 to 2009.4
The growth in home prices was accompanied by a historic increase in the homeownership rate. From 1994 to 2004, the U.S. homeownership rate increased from 64% to 69%. A rise of this magnitude in the course of a decade was last seen in the post-World War II economic boom. Minorities, especially Asians, rode the crest of this wave, narrowing the gap in homeownership with respect to whites. However, homeownership rates peaked in 2004 for whites and blacks and in 2006 for Hispanics and Asians.5 Since then, homeownership rates have been flat or declining for all groups, adding to the downward pressure on household wealth.
The Stock Market

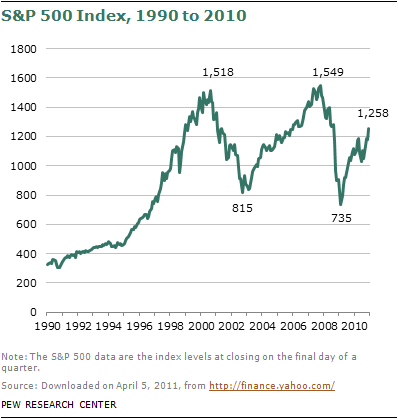
Households seeking to recoup real estate losses in the stock market would have met with disappointment. Stock prices fell sharply twice within the past decade. The first episode lasted from 2000 to 2002, surrounding the 2001 recession. The S&P 500 index dropped from a high of 1,518 in August 2000 to 815 in September 2002, a fall of 46%.
The second episode of plunging stock prices was fueled by the subprime lending crises and, not coincidentally, mostly ran parallel to the housing downturn. This time, the S&P 500 index fell from 1,549 in October 2007 to 735 in February 2009, a drop of 53%. The stock market has recovered since then and the S&P 500 had reached 1,115 by December 2009, the last date for which wealth data are reported in this study.
As noted earlier, the wealth estimates in this study are for the end of 2005 and the end of 2009. This period includes both the increase in stock prices from 2005 to 2007 and the subsequent decline through 2009. Overall, the S&P 500 fell from 1,248 in December 2005 to 1,115 in December 2009, a loss of 11%.
The Labor Market
The Great Recession lasted from December 2007 to June 2009 and was historic by most labor market indicators. The most visible labor market effect of the recession was the loss of 7.5 million jobs during its official duration. At the same time, the unemployment rate rose from 5.0% in December 2007 to 9.5% in June 2009.
Perhaps the most striking feature of the Great Recession is that those without jobs are enduring the longest spells of unemployment recorded in the post-WWII era. At the start of the recession, in December 2007, the median duration of unemployment was 8.4 weeks. By June 2009, the median duration had risen to 17.4 weeks. It continued to rise beyond the end of the recession and peaked at 25.5 weeks in June 2010.
The rise in long-term unemployment is significant. There is considerable evidence of negative consequences associated with unemployment—loss in income, career interruptions, ill effects on families and health. Moreover, long-term unemployment can feed upon itself. That is because the likelihood of reemployment falls the longer a person has been out of work.6
One feature of economic downturns is that minorities tend to experience greater increases in unemployment. The Great Recession is no exception. Job losses were higher for Hispanic and black workers than for whites. The Hispanic unemployment rate (nonseasonally adjusted) increased from 5.9% in the fourth quarter of 2007 to 12.6% in the fourth quarter of 2009. The black unemployment rate increased from 8.6% to 15.6%. The increase in the unemployment rate for whites was much less, from 3.7% to 8.0%.
A related consequence of the recession was a decline in household income. In inflation-adjusted dollars, the median income of white households fell 4%, from $56,814 in 2007 to $54,461 in 2009. The loss in income was greater for minority households. Median household income for Hispanics decreased 5% and the income of black households dropped 7%.7
The negative consequences of the Great Recession—lost jobs, record long spells of unemployment and dwindling incomes—are likely to have had an impact on household net worth above and beyond the direct effect of falling asset prices.


