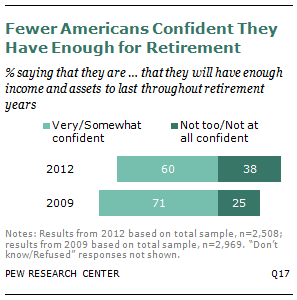
Despite a slowly improving economy and a three-year-old stock market rebound, Americans today are more worried about their retirement finances than they were at the end of the Great Recession in 2009, according to a nationally representative survey of 2,508 adults conducted by the Pew Research Center.
About four-in-ten adults (38%) say they are “not too” or “not at all” confident that they will have enough income and assets for their retirement,1 up from 25% in a Pew Research survey conducted in late February and March of 2009.
An analysis of these surveys also shows that concerns about retirement financing are now more heavily concentrated among younger and middle-aged adults than among those closer to retirement age—a major shift in the pattern that had prevailed at the end of the recession.
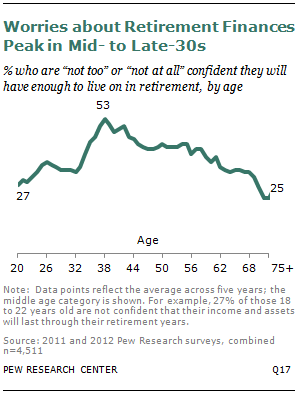
In 2009 it was “Gloomy Boomers” in their mid-50s who were the most worried that they would outlive their retirement nest eggs. Today, retirement worries peak among adults in their late 30s—many of whom are the older sons and daughters of the Baby Boom generation. According to a Pew Research analysis of Federal Reserve Board data, this is also the age group that has suffered the steepest losses in household wealth in recent years.
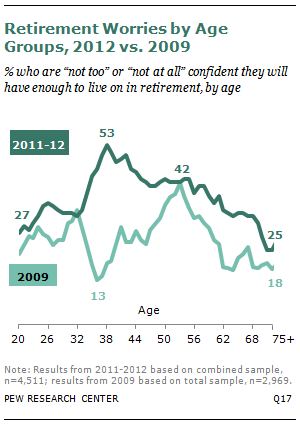
The new Pew Research survey finds that among adults between the ages of 36 and 40, 53% say they are either “not too” or “not at all” confident that their income and assets will last through retirement. In contrast, only about a third (34%) of those ages 60 to 64 express similar concerns, as do a somewhat smaller share (27%) of those 18 to 22 years old.
These findings stand in sharp contrast to the age pattern that emerged when the same question was asked in a Pew Research survey conducted in 2009. In that poll it was Baby Boomers between the ages of 51 and 55 who were the most concerned that their money would not last through their retirement years. Only 18% of those 36 to 40 years old were similarly worried they would fall short financially after they retire—a third of the share who express a similar concern today.
A companion Pew Research analysis of data collected by the Federal Reserve Board in its Survey of Consumer Finances suggests a reason that retirement concerns have surged among adults in their late 30s and early 40s.
The median net worth of this group has fallen at a far greater rate than for any other age group both in the past 10 years and since the beginning of the Great Recession.
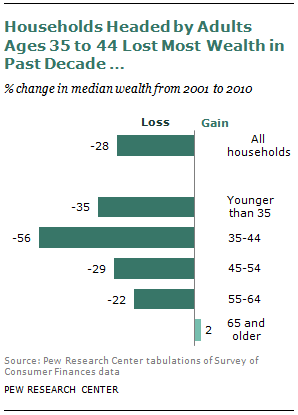
Led by declines in home value, the median wealth2 of adults ages 35 to 44 was 56% lower (in inflation-adjusted dollars) in 2010 that it had been for their same-aged counterparts in 2001— the steepest decline for any age group during that decade and more than double the rate of loss among those ages 55 to 64 (22%). (Household wealth is the sum of all assets, such as property cars, stocks and retirement accounts, minus the sum of all debts, such as mortgage, credit card debt and car loans.)
Expressed in dollars, the median wealth of those in the 35-to-44 age group in 2010 was $56,029 less than the median wealth that their same-aged counterparts had in 2000. In contrast, those ages 45 to 54 and 55 to 64 have lost about $50,000. With fewer assets to begin with, the median wealth of adults younger than 35 fell by a total of $5,270 between 2001 and 2010. The median wealth of those 65 and older increased slightly—making them the only age group whose net worth grew over what it had been for their same-aged counterparts a decade ago.
Retirement Worries Increase
Overall, a larger proportion of Americans are worried about their retirement finances now than in the final months of the Great Recession in 2009. The share of adults saying they are “not too” or “not at all” confident that they will have enough income and assets to last through their retirement years has grown from 25% in 2009 to 38% in the latest Pew Research poll.
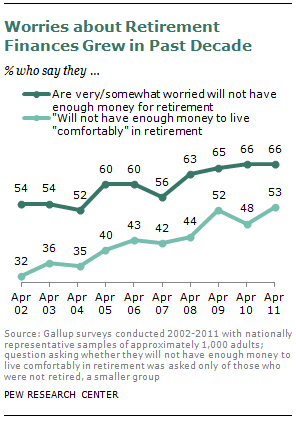
In addition, surveys conducted by the Gallup Organization over a longer time period suggest that these concerns have grown steadily in the past decade, a trend that began before the housing market collapsed or the economy fell into recession.
According to Gallup, the percentage of adults who fear they will not have enough money to live “comfortably” in retirement has grown from 32% in 2002 to 66% last year. During that same period. the share who worry that they do not have enough money to retire increased by 12 percentage points, from 54% to 66%.
The Demographics of Retirement Anxiety
While many Americans worry about retirement finances, there are some differences among demographic groups.
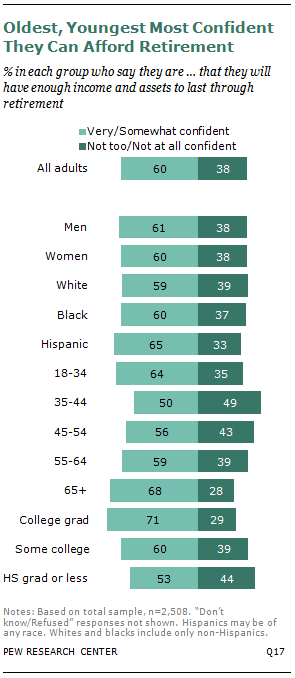
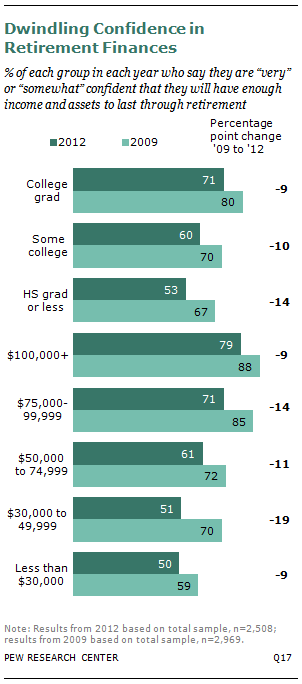
For example, college graduates are much more likely than those who have a high school diploma or less to express confidence in their retirement finances (71% vs. 53%). Among those who attended college but do not have a bachelor’s degree, six-in-ten are sure that they will be financially prepared for retirement.
Those with household incomes of $100,000 or more also are significantly more confident than those earning less than $50,000 that they will have the financial resources to live on in retirement (79% vs. 51%).
Change Since 2009
Across most demographic groups, Americans are less confident now than just three years ago that they will have enough financial resources to last through their retirement years.
The decline in confidence is greatest among Americans with less education, those with annual family incomes between $30,000 and $74,999, and adults in their late 30s and early 40s.
Among those with a high school education or less schooling, the proportion confident about retirement finances declined by 14 percentage points to 53% between 2009 and 2012 . In contrast, concern fell by 9 percentage points among college graduates and 10 points among those who attended college but did not graduate with a bachelor’s degree.
The pattern was less uniform among income groups. Confidence dropped the least among adults with the highest and lowest incomes, while the pattern is mixed among those in the middle-income ranges.
Confidence about retirement finances declined by 9 percentage points among adults in families making at least $100,000 a year and by the same share among those earning less than $30,000.
In contrast, confidence fell the most (19 percentage points, to 51%) among those earning $30,000 to $49,999 and by 14 points in families with incomes of $75,000 to $99,999. At the same time, the proportion of those making $50,000 to $74,999 who are confident about their retirement nest eggs declined by 11 points.
Retirement Worries and Age
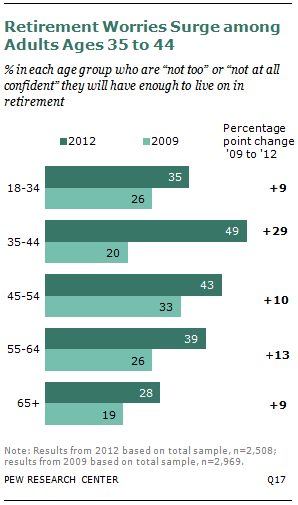
Concerns about retirement finances increased in every age group in the past three years but grew the most among adults 35 to 44, the latest Pew Research survey found. Older and younger adults express the most confidence that they will have enough financial resources in retirement, while middle-aged adults expressed the least confidence.
But in a marked change from the 2009 survey, adults in their late 30s and early 40s are now the most concerned that they will outlive their money.
Among this younger age group, the proportion who are “not too” or “not at all” confident they will have enough to live on in retirement has more than doubled, from 20% in 2009 to 49% in the latest poll. Three years ago, adults in this age group were the least likely, along with retirement-age adults (19%), to express doubts about their retirement finances. Now adults ages 35 to 44 rank ahead of every other age group in terms of their concern about retirement finances.
A Pew Research survey conducted in September 2011 produced results that closely mirrored those in the latest poll. In that survey, 51% of respondents ages 35 to 44 were concerned about retirement finances, compared with 41% of 45- to 54-year-olds and 37% of those ages 55 to 64.
Again, the oldest and youngest respondents were the least concerned. Only about a quarter of those older than 65 (25%) and younger than 35 (27%) were worried.
The Late-30s Spike
To better understand the relationship between age and retirement worries, Pew analysts created a moving average indicator to more precisely track changes in retirement confidence over the age range.3
Since the results of the 2012 and 2011 polls were so similar, data on the retirement confidence question were combined to produce a sample of 4,511 cases.
The graph on the preceding page tracks the rise and fall of retirement worries from ages 18 to 75 in the 2011-2012 surveys. The second trend line plots retirement concerns over the age range from the 2009 Pew survey.
Overall, worries about retirement finances in the 2011-2012 surveys are comparatively low among those in their early 20s. For example, only about 27% of those ages 18 to 22 say they are not too or not at all confident they will have enough to live on in retirement.
But concerns begin to rise among adults in their early 30s and spike among those a few years older. Among adults 36 to 40, about half—53%—are not confident about their retirement finances. These worries slowly ebb among individuals closer to retirement age, dropping to about a third (34%) of those 60 to 64 and falling even further among older adults well into retirement age.
A very different pattern emerges when the moving average is plotted using 2009 data. Retirement concerns peak among those ages 51 to 55; among this group, about four-in-ten (42%) lack confidence that they have enough money for retirement.
In a further departure from the most recent pattern, adults 34 to 38 years old were the least likely of any age group in 2009 (13%) to express concerns about their retirement finances—roughly the same age group that expressed the most anxiety three years later.
Declines in Wealth
Why are thirty-somethings suddenly the most worried about their retirement finances? Federal data on changes in household wealth suggest one answer. In the past decade, households headed by adults ages 35 to 44 have lost the most wealth of any age group, and nearly all of those losses have occurred since the Great Recession began in 2007.
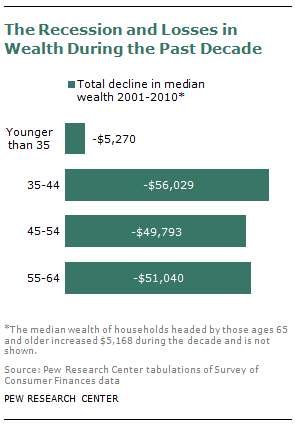
In the past 10 years, median wealth of households headed by adults 35 to 44 years old has dropped from $99,727 in 2001 to $43,698 in 2010, a 56% decline.
In contrast median wealth fell by 29% among households headed by adults ages 45 to 54 and declined by 22% among those 55 to 64 years old.
Households headed by adults 35 and younger lost 35% of their wealth, though their initial holdings—and subsequent losses—are significantly smaller than those in other age groups, dropping from $14,864 in 2001 to $9,594 in 2010.
Wealth increased in only one group in the past decade. Among households headed by adults 65 and older, wealth increased by 2%.
Not only did adults in their mid-30s and early 40s lose the largest percentage of their wealth in the past ten years, but they also lost the most money.
In actual dollars, the median wealth of those 35 to 44 fell by $56,029 from 2001 to 2010. Among those 55 to 64, wealth declined by slightly more than $50,000, while adults ages 45 t0 54 lost slightly less.
The Great Recession
The Great Recession hurt most Americans. But in terms of wealth, it was particularly painful for adults approaching or already in early middle age.
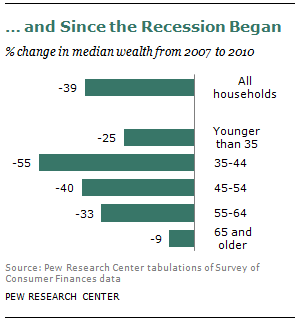
Overall median wealth declined by 39% between 2007 and 2010. Again, adults ages 35 to 44 experienced the largest proportional decline, losing 55% of their net worth during this period. The losses were smaller among adults ages 45 to 54 (40%) and those 55 to 64 (33%).
Even adults 65 and older saw their wealth decline during the recession. Median wealth among this age group fell by 9% between 2007 and 2010, though gains among older adults from 2001 to 2007 were large enough to produce a net increase in wealth over the whole decade.
Why did the Great Recession hit households headed by those in their late 30s and early 40s so hard? Data from the federal Survey of Consumer Finances provides one likely explanation.
The Housing Bubble Bursts
For most Americans, equity in their homes represents most of their wealth.4
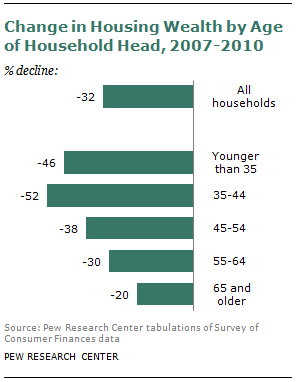
Predictably, the collapse of housing values in the middle of the past decade sent personal wealth into a nose dive for most homeowners, regardless of age. Overall, the Consumer Finances survey found that median home equity—the fair market value of a home less the amount of the outstanding mortgage and other liens—fell by about a third (32%) from 2007 to 2010. And U.S. Census data released in June found that most of the decline in median wealth between 2005 and 2010 can be attributed to sinking home values.5
But median home equity—so-called housing wealth—declined the most for homeowners ages 35 to 44. Between 2007 and 2010, the equity of homeowners in this age group was cut in half (52%). In contrast, housing wealth fell by 30% among those 55 to 64 and by 20% among adults 65 and older.
Why are younger homeowners hit so much harder? One possible answer lies in the mix of assets that comprise this younger group’s net worth. Adults 35 to 44 years old have a much greater share of their wealth represented by their home equity; this generation has not yet had the time to accumulate financial wealth. Moreover, these younger adults have had less time to build equity, so the market collapse cut into a greater share of a smaller base than for longtime homeowners.
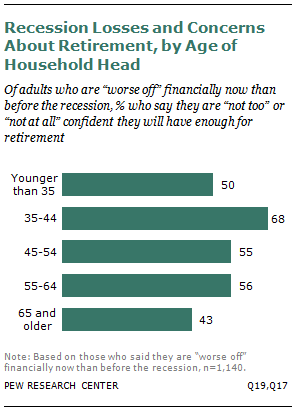
The most recent Pew survey underscores the relationship between recession losses and worries about retirement finances. Fully 45% of adults 35 to 44 say they are financially “worse off” now than before the recession. Among this group, about two-thirds (68%) say they are not confident they will have enough income and assets to last through their retirement.
In contrast, only 30% of those in this age group who say they are better off now than before the recession express similar worries.
Missing the Stock Market Rebound
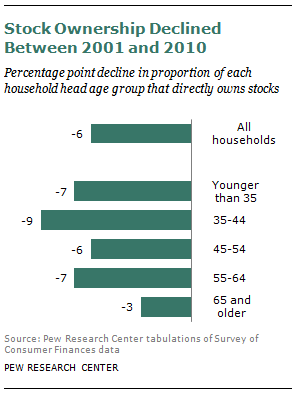
In terms of wealth, adults ages 35 to 44 were hit disproportionately hard by the Great Recession. At the same time, this age group has disproportionately failed to benefit from the Great Rebound in stock prices that began after the recession ended three years ago. The reason is that a larger share of 35- to 44-year-olds got out of the stock market between 2001 and 2010 and were on the sidelines as stock prices began to increase in 2009, according to the Pew Research analysis of data from the Survey of Consumer Finances.
The S&P 500 Index peaked at 1,576 in October 2007 but then fell to a modern low of 667 in March 2009. Since then, the stock market began a steady rise, closing at 1,258 on the last day of December 2010. It now stands at about 1,450, nearly back to its earlier peak.
The magnitude of these fluctuations nearly matches the collapse of the market just a few years earlier when the S&P 500 hit its previous high of 1,553 in March 2000, only to lose half its value to finish at 769 in October 2002.
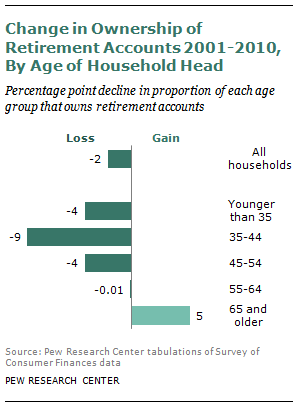
During this decade of wild market swings, ownership of stocks and retirement accounts, such as 401(k) and thrift accounts, fell among most age groups. But the declines were greatest among those ages 35 to 44. The proportion of adults in this age group who directly held stocks declined by nine percentage points from 2001 to 2010, with half of this drop occurring before 2007. In contrast, the share of adults 65 and older who directly held stocks declined only 3 percentage points from 2001 to 2010, from 21% to 18%.
The proportion of 35- to 44-year-olds who held stocks indirectly through retirement accounts also disproportionately fell by 9 percentage points, about double the decline among those younger than 35 or between 45 and 54 years old (4 percentage points for both groups).
As a consequence, those in the 35 to 44 age group have benefited less from the rapid increase in stock prices since 2009 because they were less likely than their older counterparts to own stock and retirement accounts.
About the Data
This report is based primarily on data from two different sources: Pew Research Center surveys and the federal Survey of Consumer Finances.
Findings from the latest Pew Research survey are based on telephone interviews with a nationally representative sample of 2,508 adults conducted July 16 to 26, 2012. The margin of sampling error for results based on the total sample is plus or minus 2.8 percentage points and larger for results based on part of the sample. A total of 1,505 interviews were completed with respondents contacted by landline telephone and 1,003 with those contacted on their cellular phone. Data are weighted to produce a final sample that is representative of the general population of adults in the continental United States. Survey interviews were conducted in English and Spanish under the direction of Princeton Survey Research Associates International. For more details on how the 2012 survey was conducted, go to https://www.pewresearch.org/wp-content/uploads/sites/3/2012/08/pew-social-trends-lost-decade-methodologies.pdf
The Survey of Consumer Finances (SCF) is sponsored by the Federal Reserve Board of Governors and the Department of Treasury. It has been conducted every three years since 1983 and is designed to provide detailed information on the finances of U.S. families. The SCF sample typically consists of approximately 4,500 families, but the 2010 survey included about 6,500 families. The SCF questionnaire has undergone only minor revisions since 1989, and this report analyzes SCF data from 2001 to 2010. The SCF is the nation’s foremost source of data on the wealth or net worth of the nation’s households and use of financial services.


