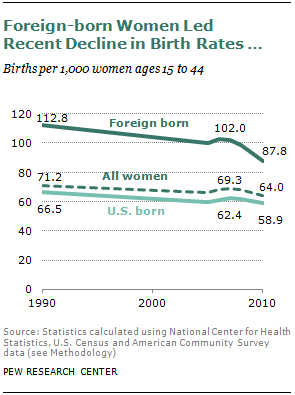
The U.S. birth rate dipped in 2011 to the lowest ever recorded, led by a plunge in births to immigrant women since the onset of the Great Recession.
The overall U.S. birth rate, which is the annual number of births per 1,000 women in the prime childbearing ages of 15 to 44, declined 8% from 2007 to 2010. The birth rate for U.S.-born women decreased 6% during these years, but the birth rate for foreign-born women plunged 14%—more than it had declined over the entire 1990-2007 period.1 The birth rate for Mexican immigrant women fell even more, by 23%.
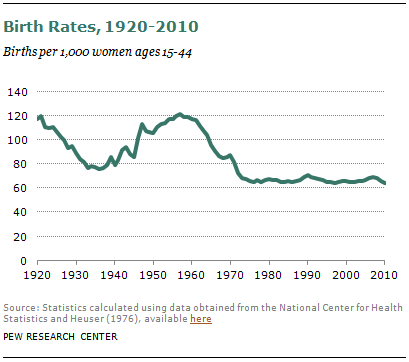
Final 2011 data are not available, but according to preliminary data from the National Center for Health Statistics, the overall birth rate in 2011 was 63.2 per 1,000 women of childbearing age. That rate is the lowest since at least 1920, the earliest year for which there are reliable numbers.2 The overall U.S. birth rate peaked most recently in the Baby Boom years, reaching 122.7 in 1957, nearly double today’s rate. The birth rate sagged through the mid-1970s but stabilized at 65-70 births per 1,000 women for most years after that before falling again after 2007, the beginning of the Great Recession.
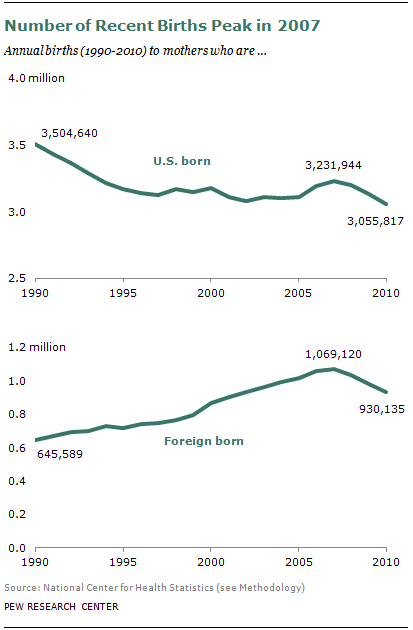
In addition to the birth rate decline, the number of U.S. births, which had been rising since 2002, fell abruptly after 2007—a decrease also led by immigrant women. From 2007 to 2010, the overall number of births declined 7%, pulled down by a 13% drop in births to immigrants and a relatively modest 5% decline in births to U.S.-born women.
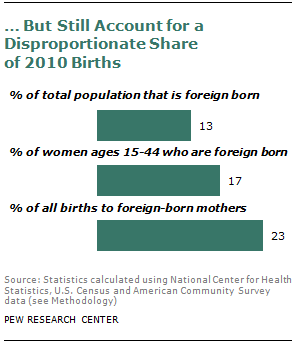
Despite the recent decline, foreign-born mothers continue to give birth to a disproportionate share of the nation’s newborns, as they have for at least the past two decades. The 23% share of all births to foreign-born mothers in 2010 was higher than the 13% immigrant share of the U.S. population, and higher than the 17% share of women ages 15-44 who are immigrants. The 2010 birth rate for foreign-born women (87.8) was nearly 50% higher than the rate for U.S.-born women (58.9).
Total U.S. births in 2010 were 4.0 million—roughly 3.1 million to U.S.-born women and 930,000 to immigrant women. In 2011, according to preliminary data, there were 3.95 million total births.
The recent downturn in births to immigrant women reversed a trend in which foreign-born mothers accounted for a rising share of U.S. births. In 2007, births to foreign-born mothers accounted for 25% of U.S. births, compared with 16% in 1990. That share decreased to 23% in 2010.
The fall in the number of births to immigrant women is explained by behavior (falling birth rates), rather than population composition (change in the number of women of childbearing age), according to a Pew Research analysis. Despite a recent drop in unauthorized immigration from Mexico, the largest source country for U.S. immigrants, the Pew Research analysis found no decline in the number of foreign-born women of childbearing age.3
This report does not address the reasons that women had fewer births after 2007, but a previous Pew Research analysis4 concluded that the recent fertility decline is closely linked to economic distress. States with the largest economic declines from 2007 to 2008, as shown by six major indicators, were most likely to experience relatively large fertility declines from 2008 to 2009, the analysis found.
Both foreign- and U.S.-born Hispanic women had larger birth rate declines from 2007 to 2010 than did other groups. Hispanics also had larger percentage declines in household wealth than white, black or Asian households from 2005 to 2009.5 Poverty and unemployment also grew more sharply for Latinos than for non-Latinos after the Great Recession began, and most Hispanics say that the economic downturn was harder on them than on other groups.6
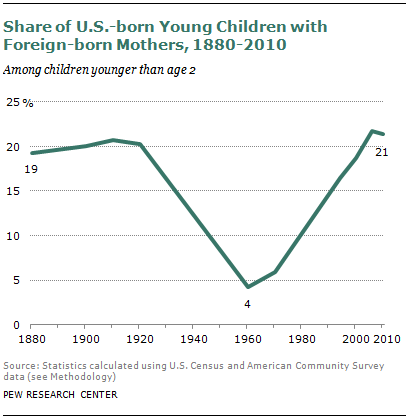
Looking back a century, data about very young children provide evidence about earlier trends.7 The share of U.S.-born children younger than age 2 with foreign-born mothers was about as high during the wave of immigration in the early 1900s (21%) as it is now. By 1960, after four decades of restrictions on immigration, that share had plummeted to a low of only 4%. It inched up to 6% by 1970 before rising rapidly as immigration levels increased due mainly to federal legislation passed in 1965.
Population projections from the Pew Research Center indicate that immigrants will continue to play a large role in U.S. population growth. The projections indicate that immigrants arriving since 2005 and their descendants will account for fully 82% of U.S. population growth by 2050.8 Even if the lower immigration influx of recent years continues, new immigrants and their descendants are still projected to account for most of the nation’s population increase by mid-century.
Among this report’s other major findings:
- A majority of births to U.S.-born women (66%) in 2010 were to white mothers (although that share was smaller than in 1990, when it was 72%), while the majority of births to foreign-born women (56%) were to Hispanic mothers.
- Teen mothers account for a higher share of births to U.S.-born women (11% in 2010) than to foreign-born women (5%), in part because of the age profile of immigrants.
- Mothers ages 35 and older account for a higher share of births to immigrants (21% in 2010) than to the U.S. born (13%). In fact, immigrants accounted for fully 33% of births to women ages 35 and older in 2010.
About This Report
This report uses data for 1990 to 2010 from the National Center for Health Statistics and the Census Bureau to analyze and compare fertility patterns of foreign-born and U.S.-born women. The report consists of an overview and section on overall trends; births by the race, ethnicity and national origin of mothers; births by age of mothers; and births by marital status of mothers. Appendix A provides details on methodology and data analysis. Appendix B includes additional tables.
This report was written by Gretchen Livingston, senior demographer, and D’Vera Cohn, senior writer, of the Pew Research Center’s Social & Demographic Trends project. Editorial guidance was provided by Paul Taylor, executive vice president of the Pew Research Center and director of its Social & Demographic Trends project. Guidance also was provided by Jeffrey Passel, senior demographer, and Kim Parker, senior researcher, both of the Pew Research Center. Charts were prepared by Eileen Patten and Seth Motel, research assistants. Number-checking was done by Motel and Patten. The report was copy-edited by Marcia Kramer.
Terminology
All references to whites, blacks and Asians are to the non-Hispanic components of those populations. Asians also include Pacific Islanders.
“U.S. born” and “native born” refer to people born in the 50 states or District of Columbia. “Foreign born” and “immigrant” are used interchangeably. In keeping with the practice of the National Center for Health Statistics, women born in Puerto Rico or other U.S. territories are included with the foreign born. See Methodology for more details.
Unless otherwise specified, “teens” refers to those ages 10 to 19.
In references to marital status, “married” includes those who are separated.


