Americans’ attitudes about gays and lesbians have changed dramatically over the past decade or so, and the LGBT adults are acutely aware of this. These changing attitudes have meant that LGBT adults feel more accepted by society now than in the past. They have also given rise to a nearly universal sense of optimism about what lies ahead for this community.
At the same time, only about one-in-five LGBT adults (19%) say there is “a lot” of social acceptance of lesbian, gay, bisexual and transgender people in this country today, and 53% say there is a lot of discrimination against these groups. And significant shares of LGBT adults report having been treated unfairly because of their sexual orientation or gender identity—through experiences ranging from poor service in restaurants and hotels to threats and physical attacks.
In the eyes of LGBT adults, greater social acceptance has come as a result of more Americans knowing someone who is lesbian, gay, bisexual or transgender as well as the efforts of high-profile public figures. A large majority (70%) says individuals simply knowing someone who is LGBT has helped a lot in terms of making society as a whole more accepting. Similar-sized majorities say well-known public figures—both LGBT (67%) and non-LGBT (66%)—have helped change societal views.
LGBT adults’ perceptions of how society has evolved differ by age and sexual orientation, as do their personal experiences with discrimination. This section will look in depth at how LGBT adults view various American institutions (including the two political parties), how they perceive and experience discrimination, and how levels of social acceptance differ across groups of LGBT adults (gay men, lesbians, bisexual men and bisexual women).
Social Acceptance
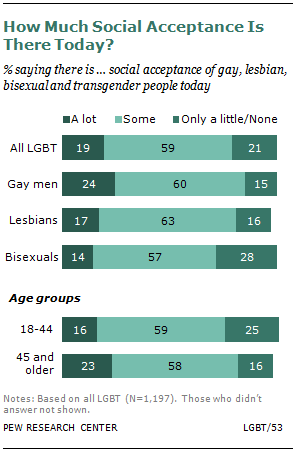
LGBT respondents were asked, overall, how much social acceptance there is of gay, lesbian, bisexual and transgender people in this country today. On this particular measure, the verdict is mixed. About one-in-five (19%) say there is a lot of acceptance for the LGBT population, 59% say there is some acceptance, and 21% say there is only a little. Just 1% say there is no acceptance at all.
Perceptions are fairly consistent across specific groups, although bisexuals have a somewhat more negative view of the current level of social acceptance. Roughly three-in-ten bisexuals (28%) say there is only a little or no acceptance of the LGBT population, compared with 15% of gay men and 16% of lesbians. In addition, middle-aged and older LGBT adults give a slightly more upbeat assessment of where things stand today. Among those ages 45 and older, 23% say there is a lot of acceptance for the LGBT population these days. Only 16% of those under age 45 say the same.
Respondents were also asked to assess the level of social acceptance for specific LGBT groups: gay men, lesbians, bisexual men, bisexual women and transgender people. Across the LGBT population, bisexual women and lesbians are viewed as being more accepted by society than gay men, bisexual men or transgender people. There is a significant gap in perceptions about the extent to which society accepts gay men and lesbians. One-in-four LGBT adults say there is a lot of social acceptance of lesbians, while only 15% say there is a lot of acceptance of gay men.
Similarly there is a gap in views about social acceptance of bisexual women and men. One-third of all LGBT adults say there is a lot of social acceptance for bisexual women; only 8% say the same about bisexual men.
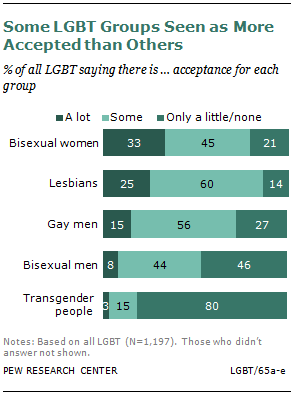
LGBT adults see relatively little social acceptance for transgender people. Fully eight-in-ten say there is only a little (59%) or no (21%) social acceptance of this group. Only 3% say there is a lot of acceptance, and 15% say there is some.
When it comes to social acceptance of gay men, gay men themselves are just as likely as lesbians and bisexuals to say there is a lot of social acceptance for their group. They are somewhat more likely than lesbians or bisexuals to say there is some social acceptance (and less likely to say there is only a little or no acceptance).
Lesbians’ views about how much their group is accepted by society are almost identical to the views of gay men and bisexuals. Roughly one-in-four from each group say there is a lot of social acceptance for lesbians, and about six-in-ten say there is some social acceptance for this group.
Among bisexuals, men and women agree that there is a lot more social acceptance for female bisexuals than there is for male bisexuals.
Most See Progress and Expect More to Come
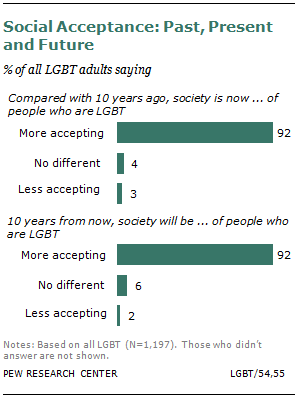
When survey respondents were asked how the level of overall social acceptance of people who are LGBT has changed over the past decade, their reactions were overwhelmingly positive. About nine-in-ten LGBT adults (92%) say society is more accepting of gay, lesbian, bisexual and transgender people than it was 10 years ago. This breaks down to 52% who say society is a lot more accepting today and 40% who say society is a little more accepting. An additional 4% of LGBT adults say things are no different in this regard than they were 10 years ago, and 3% say society is either a lot or a little less accepting today.
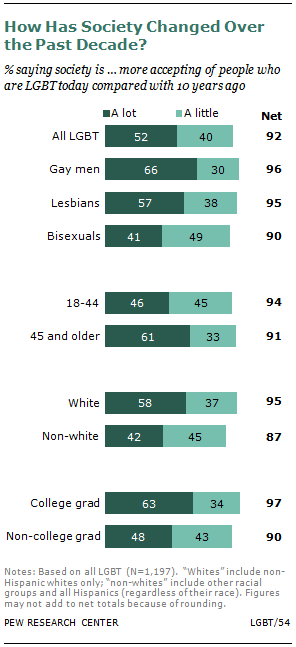
Gay men and lesbians have a more positive assessment than bisexuals of how things have changed over the past decade. Majorities from each group (66% of gay men and 57% of lesbians) say society is a lot more accepting of the LGBT population today than was the case 10 years ago. Among bisexuals, 41% say society is now a lot more accepting.
Evaluations of progress vary widely across key demographic groups. Again age is a factor, with middle-aged and older LGBT adults much more likely to see progress than younger LGBT adults. Among those ages 45 and older, 61% say society is a lot more accepting now than it was 10 years ago. Among those ages 18 to 44, only 46% agree with this assessment. Older LGBT adults have had the opportunity to witness more change and may have a greater understanding of the degree to which public views have shifted.
Among all LGBT adults, whites are more likely than non-whites to say society is a lot more accepting now (58% vs. 42%).10 Similarly, a greater share of college graduates (63%) than non-college graduates (48%) say they think society has become a lot more accepting of the LGBT population over the past decade.
Looking ahead to the next 10 years, the vast majority of LGBT adults expect society to become even more accepting of them. Fully 92% say, looking ahead 10 years from now, they think there will be greater acceptance of gay, lesbian, bisexual and transgender people in this country. Roughly two-thirds (65%) say society will be a lot more accepting 10 years from now, and an additional 27% say society will be a little more accepting. Some 6% say things will be no different from the way they are now, and only 2% say society will be less accepting of the LGBT population 10 years from now.
Gay men and lesbians are much more optimistic than bisexuals about societal acceptance increasing in the future: 71% of gay men and 76% of lesbians, compared with 58% of bisexuals, say society will be a lot more accepting of the LGBT population 10 years from now. Opinions also differ by race: 69% of whites compared with 58% of non-whites say there will be a lot more acceptance a decade from now.
Why Are Societal Views Changing?
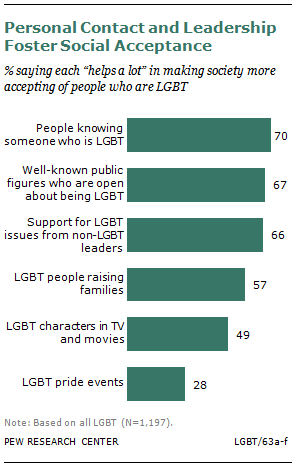
Respondents were asked about the various factors that may have contributed to increased acceptance of people who are LGBT. Individual relationships and the role of well-known public figures are viewed as being the most helpful things in terms of fostering acceptance. Fully seven-in-ten LGBT adults say people knowing someone who is lesbian, gay, bisexual or transgender helps a lot, and 24% say this helps a little.
A similar majority say well-known public figures who are open about being LGBT help make society more accepting (67% say this helps a lot, and 27% say this helps a little). LGBT adults say public figures who support LGBT issues but are not LGBT themselves are equally helpful in terms of increasing public acceptance: 66% say these leaders help a lot, and 28% say they help a little.
A smaller share of LGBT adults think that LGBT characters in TV shows and movies have a positive impact on societal acceptance. About half of all LGBT adults (49%) say these characters help a lot, and 42% say they help a little.
The presence of LGBT adults raising families these days is seen as a positive factor for most LGBT respondents. Some 57% say LGBT adults raising families helps a lot in making society more accepting of the community, and an additional 35% say this helps a little.
Even fewer see LGBT pride events as being very helpful in making society more accepting. Only 28% say these events help a lot, and 48% say they help a little. One-in-five (21%) say these events do not help improve societal acceptance of the LGBT population.
Gay men and lesbians are more likely than bisexuals to see a lot of value in people knowing someone who is LGBT and in the influence of public figures who are open about being LGBT. College graduates are more likely than those without a college degree to see a large benefit from knowing someone who is LGBT and from the support of non-LGBT leaders for LGBT issues.
While pride events are seen as the least helpful in making society more accepting of the LGBT population, there are some important demographic differences. Non-white LGBT adults are more likely than whites to say these events help a lot in terms of bringing about greater social acceptance (36% vs. 24%, respectively). Younger LGBT adults have a more positive view of these events than their older counterparts. Among those ages 18 to 44, 33% say these events help a lot; this compares with 22% of those ages 45 and older. Finally, LGBT adults who have not graduated from college are about twice as likely as college graduates to say LGBT pride events help a lot (34% vs. 16%).
Barack Obama, Ellen DeGeneres Most Important Public Figures
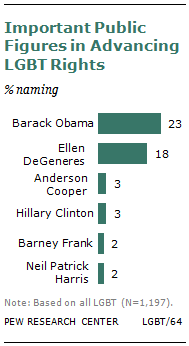
LGBT respondents were asked to name public figures at the national level who have been important in advancing the rights of people who are LGBT. Two very different public figures stand out from all the rest: Barack Obama and Ellen DeGeneres. Roughly one-in-four LGBT adults (23%) named President Obama when asked for an important national figure in advancing LGBT rights. Some 18% named talk show host Ellen DeGeneres. DeGeneres made national news in 1997 when she came out publicly as a lesbian—first on “The Oprah Winfrey Show” and soon after on “The Ellen Show.”
Just one year ago, Obama announced that he supported same-sex marriage. He had opposed same-sex marriage in the past and spoke last year about the evolution of his views. Obama spoke again about same-sex marriage and LGBT rights more generally in his January 2013 inaugural address.
White and non-white LGBT adults are equally likely to point to Obama as an important public figure in advancing the LGBT rights. And there is no significant age gap in the share naming Obama as an important public figure.
Roughly equal shares of gay men (30%) and lesbians (24%) name Obama as an important figure in advancing LGBT rights. Not surprisingly, lesbians are more likely than gay men to name DeGeneres as an important figure (27% vs. 16%). And she has more bipartisan appeal than Obama: 19% of LGBT adults who identify with or lean toward the Democratic Party name DeGeneres as an important public figure, as do 15% of LGBT adults who identify with or lean toward the Republican Party. Democrats are much more likely than Republicans to name Obama (26% vs. 10%).
Voices: Which Public Figures, at the National Level, Have Been Important in Advancing LGBT Rights?
“Barack Obama helps a lot—I am amazed to have a sitting president supporting my right to marry. Also, the lawyers arguing the two Supreme Court cases, and the Supreme Court justices themselves.” –Lesbian, age 32
“Any and all elected government officials who support and accept that gay people deserve complete equality as citizens. I believe it was profoundly brave of President Obama to end the “don’t ask, don’t tell” policy.” –Gay man, age 60
“Ellen DeGeneres—I know it sounds corny, but she has been out for so long that it is no longer an issue, and older white women feel comfortable with her show. She normalizes LGBT people.” –Bisexual woman, age 31
“Well of course Ellen started something very big! But having celebrities like Wanda Sykes come out, get married, and have children has given more visibility to the lives of the LGBT community. And President Obama publicly declaring his changed views and support has been absolutely huge!” –Lesbian, age 33
“Anderson Cooper. By far the most influential person to come out publicly. Very well respected man and seen as a trusted member of the news corps.” –Gay man, age 43
“Politically? Hillary Clinton, Obama, and right now those Republicans who are now supporting the rights because one of their family members has come out. I think that’s going to help a lot. Public figures like celebrities? Anne Hathaway, Brad and Angelina, Pink.” –Bisexual woman, age 37
“I think the most influential public figures are the ones who were opposed to gay marriage previously, but have changed their perspective. Those with LGBT friends or family members are often the first to change their minds, and their admission is very powerful.” –Lesbian, age 45
LGBT/64
Some 3% of LGBT respondents name CNN’s Anderson Cooper and an equal share name Hillary Clinton when asked which public figures were important in advancing the rights of the LGBT population. Former representative Barney Frank and actor Neil Patrick Harris, both openly gay, were each named by 2% of respondents.
Other individuals who were mentioned by at least 1% of respondents include a mix of political figures: Joe Biden, Michelle Obama and Tammy Baldwin and entertainers and media personalities: Lady Gaga, Frank Ocean, Elton John, Rachel Maddow, George Takei and Wanda Sykes.11
Overall, LGBT adults are just as likely to point to political or civic leaders (31%) as they are to name well-known entertainers or media personalities (29%) when asked to name public figures who have been important in advancing the rights of the LGBT population. Many respondents couldn’t come up with an answer. Some 19% said they didn’t know of any public figures, and 30% refused to answer the question.
LGBT Views on Political Parties and Institutions
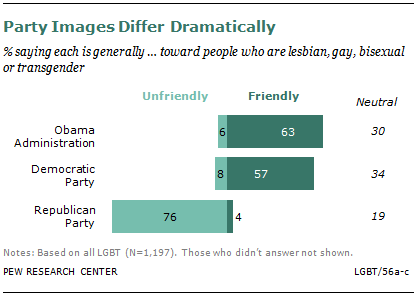
When it comes to politics, most LGBT adults are affiliated with the Democratic Party, and one very important reason for that may be that they believe that the Democrats are friendly toward them and that the Republicans are not.
About six-in-ten (57%) say the Democratic Party is generally friendly toward lesbian, gay, bisexual and transgender people. About one-third of LGBT adults (34%) say the Democratic Party is neutral toward them, and only 8% say the party is unfriendly.
Some 63% of LGBT adults say the Obama administration is friendly toward them, 30% say the administration is neutral toward them, and 6% say it is unfriendly. The LGBT population has a much different view of the Republican Party. Only 4% say the GOP is generally friendly toward people who are lesbian, gay, bisexual or transgender, while 76% say the party is unfriendly. An additional 19% views the Republican Party as neutral toward the LGBT population.
Gay men and lesbians are more likely than bisexuals to see the Democratic Party as friendly to the LGBT population and to see the Republican Party as unfriendly. Middle-aged and older LGBT adults also have a more favorable view of the Democrats than younger LGBT adults: 66% of those ages 45 and older say the Democratic Party is friendly to the LGBT population, compared with 51% of those ages 18 to 44. These two age groups are equally likely to view the Republican Party as unfriendly to the LGBT population.
Many LGBT adults who are Republican or lean toward the Republican Party share the view that the GOP is unfriendly to the LGBT population. Among this group, roughly half (47%) say the Republican Party is unfriendly to the LGBT population, and only 13% say the party is friendly. LGBT adults who are Democrats or lean to the Democratic Party overwhelmingly say the GOP is unfriendly to the LGBT population: 83% say this, while only 2% see the GOP as friendly.
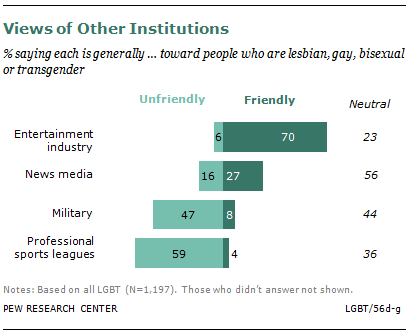
Respondents were asked about a series of other institutions and organizations. Most LGBT adults (70%) view the entertainment industry as friendly toward people who are LGBT. Only 6% say the entertainment industry is unfriendly to the LGBT population, and 23% say the industry is neutral. Gay men stand out in this regard, with 80% saying the entertainment industry is friendly to the LGBT population. Lesbians and bisexuals are significantly less likely to express this view. Some 65% from each group say the entertainment industry is generally friendly to the LGBT population.
Of the four institutions tested in the poll, the entertainment industry is clearly viewed as being the friendliest toward people who are LGBT. The news media are perceived as being more neutral than friendly. About six-in-ten LGBT adults (56%) say the news media are neutral toward the LGBT population, while 27% view the media as friendly to the community and 16% say the media are unfriendly.
Even as it has taken steps to remove the barriers that have prevented gay and lesbian adults from serving openly, the military is viewed by many LGBT adults as being unfriendly toward them. Fully 47% say the military is unfriendly toward the LGBT population, while a similar share (44%) says the military is neutral. Only 8% say the military is friendly toward people who are LGBT. Lesbians and bisexuals are significantly more likely than gay men to view the military as unfriendly (51% of lesbians and 52% of bisexuals say so, compared with 39% of gay men).
Professional sports leagues have an even more negative image among LGBT adults. A majority (59%) say these leagues are unfriendly to the LGBT population. About one-third (36%) say pro sports leagues are neutral toward the LGBT population, and only 4% view them as friendly. Gay men, lesbians and bisexuals all express similar views about professional sports. Notably, since the survey was completed, two male athletes—NBA basketball player Jason Collins and professional soccer player Robbie Rogers—have revealed that they are gay.
Discrimination Persists Amid Social Progress
While they feel that social acceptance of the LGBT population has increased over the past decade and that it will increase even more in the future, most LGBT adults still feel, as a group, they are discriminated against. Fully half (53%) say there is a lot of discrimination against gays and lesbians, and an additional 39% say there is some discrimination. About one-in-ten say there is only a little discrimination against gays and lesbians (6%) or none at all (1%).12
There are no significant differences among gay men, lesbians and bisexuals in terms of the level of discrimination they perceive against gays and lesbians (55% of gay men, 61% of lesbians and 51% of bisexuals say there is a lot of discrimination).
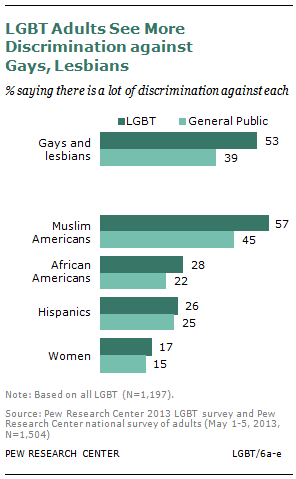
LGBT adults are much more likely than the general public to say there is discrimination against gays and lesbians. In a 2013 Pew Research Center nationwide survey of all adults, 39% said there is a lot of discrimination against this group, and 33% say there is some discrimination. Roughly one-in-four adults (23%) said there is only a little discrimination or no discrimination against gays and lesbians.13
There is a significant age gap in views on this issue. Among the general public and the LGBT population, young adults (those ages 18 to 29) are more likely than their older counterparts to say there is discrimination against gays and lesbians these days. Fully half (52%) of all adults younger than 30 and 62% of LGBT adults in that age group say there is a lot of discrimination today against gays and lesbians.
The survey also asked about four other groups, each with its own legacy of discrimination: Muslim Americans, African Americans, Hispanic Americans and women. For both LGBT adults and the general public, Muslim Americans and gays and lesbians are seen as the two groups facing the most discrimination. LGBT adults are somewhat more likely than all adults to say there is a lot of discrimination against Muslim Americans (57% vs. 45%). Still, both groups rank Muslim Americans as facing more discrimination today than blacks, Hispanics or women.
About three-in-ten (28%) LGBT adults say there is a lot of discrimination against African Americans in our society today. The share is slightly lower among the general public (22%).
Roughly a quarter of LGBT adults (26%) and all adults (25%) say there is a lot of discrimination against Hispanics today. Among LGBT adults who are white and non-Hispanic, 23% say there is a lot of discrimination against Hispanics; 20% of all white, non-Hispanic adults say the same.
Within the LGBT population and among the general public, women are less likely than other groups to be viewed as victims of discrimination. Some 17% of LGBT adults and 15% of all adults say there is a lot of discrimination against women today. In both groups, women are much more likely than men to say their gender is discriminated against (the same share of LGBT women and all women, 21%, say there is a lot of discrimination against women).
LGBT Status Makes Some a Target
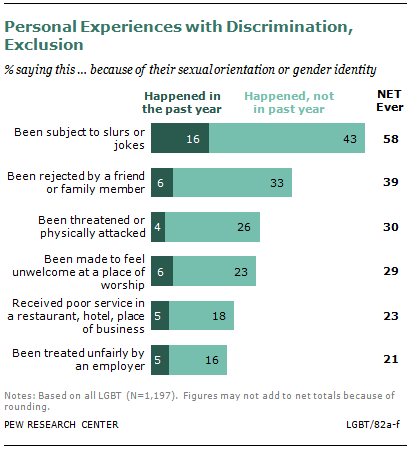
Many lesbian, gay, bisexual and transgender adults say they have experienced discrimination on a personal level because of their sexual orientation or gender identity. The survey included six types of incidents—ranging from poor service in restaurants to physical attacks—and found that two-thirds of all LGBT respondents (66%) had experienced at least one of them.
The most common occurrence among the survey respondents is being the subject of slurs or jokes. Some 58% of LGBT adults say they have experienced this at some point, including 16% who say this has happened to them in the past year.
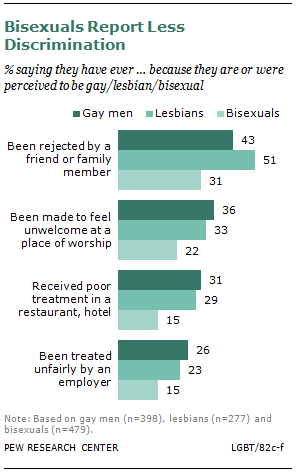
About four-in-ten (39%) say they have been rejected by a friend or family member at some point; 6% say this has happened to them in the past 12 months.
Three-in-ten LGBT adults say they have been threatened or physically attacked (4% in the past year). And a similar share (29%) say they have been made to feel unwelcome at a place of worship or religious organization (6% in the past year).
About one-in-four LGBT adults (23%) have received poor service in a restaurant, hotel or other places of business, with 5% saying this has happened to them in the past 12 months. And 21% of LGBT adults say they have been treated unfairly by an employer in hiring, pay or promotions (5% in the past year).
Gay men and lesbians are significantly more likely than bisexuals to have had these types of experiences. Fully 84% of gay men say they have experienced at least one of these things, as do 73% of lesbians. This compares with 49% of bisexuals. Gay men are the most likely to have experienced several of these things—33% of gay men say four or more of things have happened to them compared with 22% of lesbians and 16% of bisexuals.
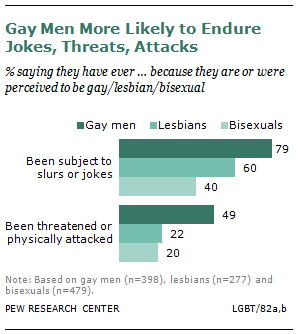
There are two types of experiences where gay men stand out in particular: being subjected to jokes or slurs and being physically attacked or threatened. About eight-in-ten gay men (79%) say they have been subjected to jokes or slurs in the past; 21% say they have dealt with this in the last 12 months. By comparison, 60% of lesbians have ever been subjected to jokes or slurs, as have 40% of bisexuals.
There are other types of incidents that gay men and lesbians are equally likely to have experienced: being rejected by a friend or family member; being made to feel unwelcome at a place of worship or religious organization; receiving poor treatment in a restaurant, hotel or other place of business; and being treated unfairly by an employer. In most cases, bisexuals are significantly less likely to report having experienced such an incident.
Among all LGBT adults, whites and non-whites are equally likely to have experienced these types of discrimination. And there are few significant differences by age. LGBT adults under age 45 are somewhat more likely than older LGBT adults to say they have been made to feel unwelcome at a church or religious organization (32% vs. 24%). But there is no age gap on the other items tested in the poll.
LGBT adults living in the South are more likely than those living in the Northeast and Midwest to have experienced four or more of these incidents—29% vs. 18% for the Northeast and 19% for the Midwest. LGBT adults living in the West are not statistically different from any of the three regional groups in this regard (22% say they’ve experienced four or more of these incidents).
