For those who question the value of college in this era of soaring student debt and high unemployment, the attitudes and experiences of today’s young adults—members of the so-called Millennial generation—provide a compelling answer. On virtually every measure of economic well-being and career attainment—from personal earnings to job satisfaction to the share employed full time—young college graduates are outperforming their peers with less education. And when today’s young adults are compared with previous generations, the disparity in economic outcomes between college graduates and those with a high school diploma or less formal schooling has never been greater in the modern era.
These assessments are based on findings from a new nationally representative Pew Research Center survey of 2,002 adults supplemented by a Pew Research analysis of economic data from the U.S. Census Bureau.
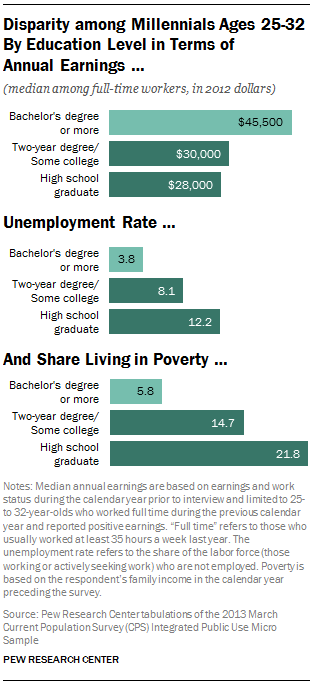
The economic analysis finds that Millennial college graduates ages 25 to 321 who are working full time earn more annually—about $17,500 more—than employed young adults holding only a high school diploma. The pay gap was significantly smaller in previous generations.2 College-educated Millennials also are more likely to be employed full time than their less-educated counterparts (89% vs. 82%) and significantly less likely to be unemployed (3.8% vs. 12.2%).

[them]
The survey also finds that among employed Millennials, college graduates are significantly more likely than those without any college experience to say that their education has been “very useful” in preparing them for work and a career (46% vs. 31%). And these better educated young adults are more likely to say they have the necessary education and training to advance in their careers (63% vs. 41%).
But do these benefits outweigh the financial burden imposed by four or more years of college? Among Millennials ages 25 to 32, the answer is clearly yes: About nine-in-ten with at least a bachelor’s degree say college has already paid off (72%) or will pay off in the future (17%). Even among the two-thirds of college-educated Millennials who borrowed money to pay for their schooling, about nine-in-ten (86%) say their degrees have been worth it or expect that they will be in the future.
Of course, the economic and career benefits of a college degree are not limited to Millennials. Overall, the survey and economic analysis consistently find that college graduates regardless of generation are doing better than those with less education.3
But the Pew Research study also finds that on some key measures, the largest and most striking disparities between college graduates and those with less education surface in the Millennial generation.
For example, in 1979 when the first wave of Baby Boomers were the same age that Millennials are today, the typical high school graduate earned about three-quarters (77%) of what a college graduate made. Today, Millennials with only a high school diploma earn 62% of what the typical college graduate earns.
To be sure, the Great Recession and the subsequent slow recovery hit the Millennial generation particularly hard.4 Neither college graduates nor those with less education were spared. On some key measures such as the percentage who are unemployed or the share living in poverty, this generation of college-educated adults is faring worse than Gen Xers, Baby Boomers or members of the Silent generation when they were in their mid-20s and early 30s.
But today’s high school graduates are doing even worse, both in comparison to their college-educated peers and when measured against other generations of high school graduates at a similar point in their lives.
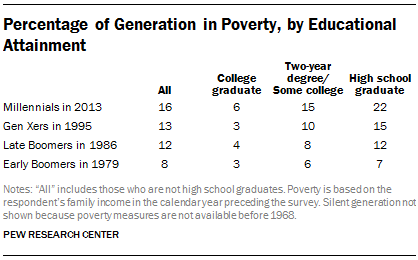
For example, among those ages 25 to 32, fully 22% with only a high school diploma are living in poverty, compared with 6% of today’s college-educated young adults. In contrast, only 7% of Baby Boomers who had only a high school diploma were in poverty in 1979 when they were in their late 20s and early 30s.
To examine the value of education in today’s job market, the Pew Research Center drew from two complementary data sources. The first is a nationally representative survey conducted Oct. 7-27, 2013, of 2,002 adults, including 630 Millennials ages 25-32, the age at which most of these young adults will have completed their formal education and started their working lives. This survey captured the views of today’s adults toward their education, their job and their experiences in the workforce.
To measure how the economic outcomes of older Millennials compare with those of other generations at a comparable age, the Pew Research demographic analysis drew from data collected in the government’s Current Population Survey. The CPS is a large-sample survey that has been conducted monthly by the U.S. Census Bureau for more than six decades.
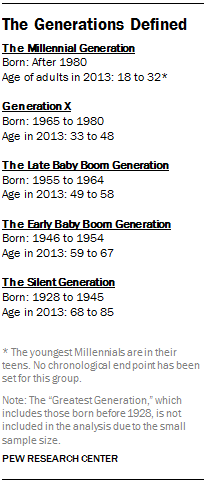
Specifically, Pew analysts examined CPS data collected last year among 25- to 32-year-olds and then examined data among 25- to 32-year-olds in four earlier years: Silents in 1965 (ages 68 to 85 at the time of the Pew Research survey and Current Population Survey); the first or “early” wave of Baby Boomers in 1979 (ages 59 to 67 in 2013), the younger or “late” wave of Baby Boomers in 1986 (ages 49 to 58 in 2013) and Gen Xers in 1995 (ages 33 to 48 in 2013).
The Rise of the College Graduate
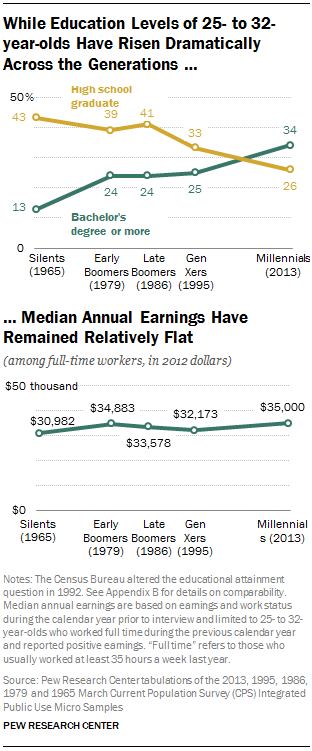
Today’s Millennials are the best-educated generation in history; fully a third (34%) have at least a bachelor’s degree. In contrast, only 13% of 25- to 32-year-olds in 1965—the Silent generation—had a college degree, a proportion that increased to 24% in the late 1970s and 1980s when Boomers were young adults. In contrast, the proportion with a high school diploma has declined from 43% in 1965 to barely a quarter (26%) today.
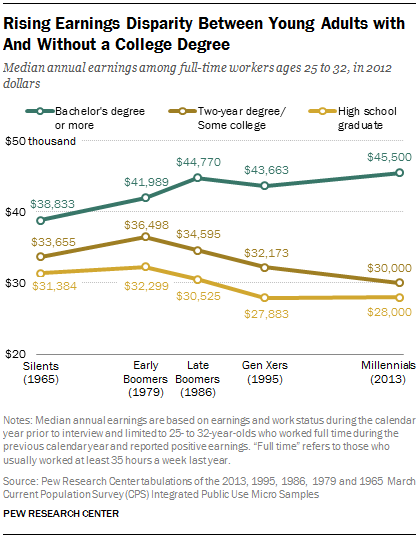
At the same time the share of college graduates has grown, the value of their degrees has increased. Between 1965 and last year, the median annual earnings of 25- to 32-year-olds with a college degree grew from $38,833 to $45,500 in 2012 dollars, nearly a $7,000 increase.
Taken together, these two facts—the growing economic return to a college degree and the larger share of college graduates in the Millennial generation—might suggest that the Millennial generation should be earning more than earlier generations of young adults.
But they’re not. The overall median earnings of today’s Millennials ($35,000) aren’t much different than the earnings of early Boomers ($34,883) or Gen Xers ($32,173) and only somewhat higher than Silents ($30,982) at comparable ages.
The Declining Value of a High School Diploma
The explanation for this puzzling finding lies in another major economic trend reshaping the economic landscape: The dramatic decline in the value of a high school education. While earnings of those with a college degree rose, the typical high school graduate’s earnings fell by more than $3,000, from $31,384 in 1965 to $28,000 in 2013. This decline, the Pew Research analysis found, has been large enough to nearly offset the gains of college graduates.
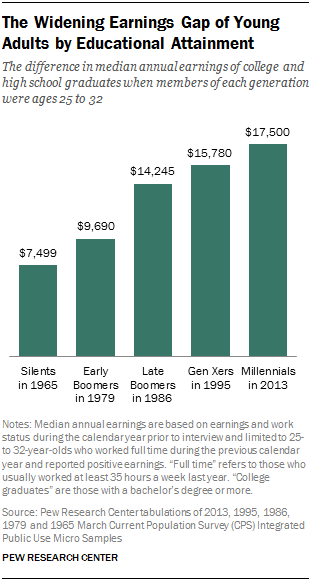
The steadily widening earnings gap by educational attainment is further highlighted when the analysis shifts to track the difference over time in median earnings of college graduates versus those with a high school diploma.
In 1965, young college graduates earned $7,499 more than those with a high school diploma. But the earnings gap by educational attainment has steadily widened since then, and today it has more than doubled to $17,500 among Millennials ages 25 to 32.
Other Labor Market Outcomes
To be sure, the Great Recession and painfully slow recovery have taken their toll on the Millennial generation, including the college-educated.
Young college graduates are having more difficulty landing work than earlier cohorts. They are more likely to be unemployed and have to search longer for a job than earlier generations of young adults.
But the picture is consistently bleaker for less-educated workers: On a range of measures, they not only fare worse than the college-educated, but they are doing worse than earlier generations at a similar age.
For example, the unemployment rate for Millennials with a college degree is more than double the rate for college-educated Silents in 1965 (3.8% vs. 1.4%). But the unemployment rate for Millennials with only a high school diploma is even higher: 12.2%, or more than 8 percentage points more than for college graduates and almost triple the unemployment rate of Silents with a high school diploma in 1965.
The same pattern resurfaces when the measure shifts to the length of time the typical job seeker spends looking for work. In 2013 the average unemployed college-educated Millennial had been looking for work for 27 weeks—more than double the time it took an unemployed college-educated 25- to 32-year-old in 1979 to get a job (12 weeks). Again, today’s young high school graduates fare worse on this measure than the college-educated or their peers in earlier generations. According to the analysis, Millennial high school graduates spend, on average, four weeks longer looking for work than college graduates (31 weeks vs. 27 weeks) and more than twice as long as similarly educated early Boomers did in 1979 (12 weeks).
Similarly, in terms of hours worked, likelihood of full-time employment and overall wealth, today’s young college graduates fare worse than their peers in earlier generations. But again, Millennials without a college degree fare worse, not only in comparison to their college-educated contemporaries but also when compared with similarly educated young adults in earlier generations.
The Value of a College Major
As the previous sections show, having a college degree is helpful in today’s job market. But depending on their major field of study, some are more relevant on the job than others, the Pew Research survey finds.
To measure the value of their college studies, all college graduates were asked their major or, if they held a graduate or professional degree, their field of study. Overall, 37% say they were social science, liberal arts or education majors, a third (33%) say they studied a branch of science or engineering and a quarter (26%) majored in business. The remainder said they were studying or training for a vocational occupation.
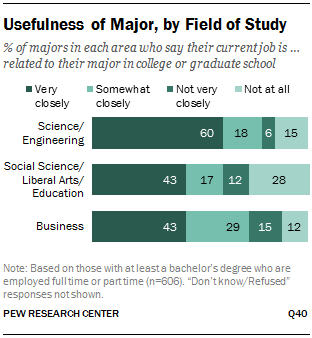
Overall, those who studied science or engineering are the most likely to say that their current job is “very closely” related to their college or graduate field of study (60% vs. 43% for both social science, liberal arts or education majors and business majors).
At the same time, those who majored in science or engineering are less likely than social science, liberal arts or education majors to say in response to another survey question that they should have chosen a different major as an undergraduate to better prepare them for the job they wanted.
According to the survey, only about a quarter of science and engineering majors regretted their decision (24%), compared with 33% of those whose degree is in social science, liberal arts or education. Some 28% of business majors say they would have been better prepared for the job they wanted if they had chosen a different major. (Overall, the survey found that 29% say they should have chosen a different major to better prepare them for their ideal job.)
Major Regrets
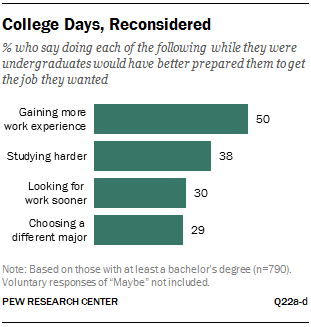
In addition to selecting a different major, the Pew Research survey asked college graduates whether, while still in school, they could have better prepared for the type of job they wanted by gaining more work experience, studying harder or beginning their job search earlier.
About three-quarters of all college graduates say taking at least one of those four steps would have enhanced their chances to land their ideal job. Leading the should-have-done list: getting more work experience while still in school. Half say taking this step would have put them in a better position to get the kind of job they wanted. About four-in-ten (38%) regret not studying harder, while three-in-ten say they should have started looking for a job sooner (30%) or picked a different major (29%).
When analyzed together, the survey suggests that, among these items tested, only about a quarter (26%) of all college graduates have no regrets, while 21% say they should have done at least three or all four things differently while in college to enhance their chances for a job they wanted.
The survey also found that Millennials are more likely than Boomers to have multiple regrets about their college days. Three-in-ten (31%) of all Millennials and 17% of Boomers say they should have done three or all four things differently in order to prepare themselves for the job they wanted. Some 22% of Gen Xers say the same.
The remainder of this report is organized in the following way. The first chapter uses Census Bureau data to compare how Millennials ages 25 to 32 with varying levels of education are faring economically. It also examines how economic outcomes by level of education have changed over time by comparing the economic fortunes of Millennials with those of similarly educated Gen Xers, Baby Boomers and Silents at comparable ages.
The second chapter is based exclusively on data from a recent Pew Research Center survey. It examines how all adults assess the value of their education in preparing them for the workforce and specifically how these views differ by levels of education.
About the Data
Findings in this report are based mainly on data from: (1) The Current Population Survey and (2) A new Pew Research Center survey conducted in October 2013.
Data on Labor Market and Economic Outcomes: The labor market and economic data are derived from the Current Population Survey (CPS). Conducted jointly by the U.S. Census Bureau and the Bureau of Labor Statistics, the CPS is a monthly survey of approximately 55,000 households and is the source of the nation’s official statistics on unemployment. The CPS is nationally representative of the civilian noninstitutionalized population. This analysis uses the Annual Social and Economic Supplement collected in March of each year. The March CPS features an expanded sample size (about 75,000 households in 2013) and is the basis for the widely noted Census Bureau’s annual Income, Poverty, and Health Insurance Coverage estimates reported each fall (DeNavas-Walt, Proctor and Smith ,2013). The data analysis used the University of Minnesota Population Center’s integrated version of the March CPS (King, Ruggles, Alexander, Flood, Genadek, Schroeder, Trampe, and Vick ,2010).
Survey Data: The Pew Research survey was conducted October 7-27, 2013, with a nationally representative sample of 2,002 adults age 18 and older, including 982 adults ages 18 to 34. A total of 479 interviews were completed with respondents contacted by landline telephone and 1,523 with those contacted on their cellular phones. In order to increase the number of 25- to 34-year-old respondents in the sample, additional interviews were conducted with that cohort. Data are weighted to produce a final sample that is representative of the general population of adults in the United States. Survey interviews were conducted in English and Spanish under the direction of Princeton Survey Research Associates International. Margin of sampling error is plus or minus 2.7 percentage points for results based on the total sample at the 95% confidence level.
