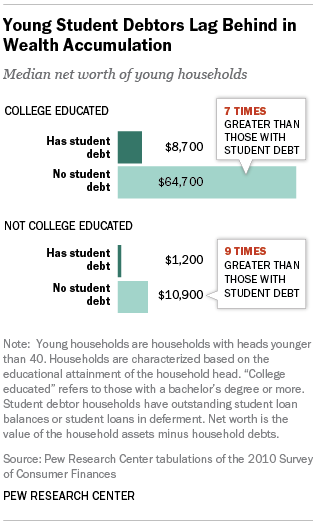
Student debt burdens are weighing on the economic fortunes of younger Americans, as households headed by young adults owing student debt lag far behind their peers in terms of wealth accumulation, according to a new Pew Research Center analysis of government data. About four-in-ten U.S. households (37%) headed by an adult younger than 40 currently have some student debt—the highest share on record, with the median outstanding student debt load standing at about $13,ooo.
An analysis of the most recent Survey of Consumer Finances finds that households headed by a young, college-educated adult without any student debt obligations have about seven times the typical net worth ($64,700) of households headed by a young, college-educated adult with student debt ($8,700). And the wealth gap is also large for households headed by young adults without a bachelor’s degree: Those with no student debt have accumulated roughly nine times as much wealth as debtor households ($10,900 vs. $1,200). This is true despite the fact that debtors and non-debtors have nearly identical household incomes in each group.
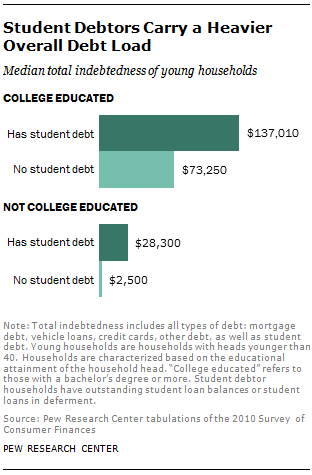
While these stark differences in wealth accumulation are accounted for in part by outstanding student debt, that’s only part of the story. Since the typical young student debtor household has about $13,000 in outstanding student loan obligations and the overall wealth gap is much larger, clearly other factors are also at work. Specifically, student debtor households are accumulating less wealth, in part, because they tend to owe relatively large amounts of other debt as well, from car loans to credit card debt. Among the young and college educated, the typical total indebtedness (including mortgage debt, vehicle debt and credit cards, as well as student debt) of student debtor households ($137,010) is almost twice the overall debt load of similar households with no student debt ($73,250). Among less-educated households, the total debt load of student debtors ($28,300) is more than ten times that of similar households not owing student debt ($2,500).
While taking on debt to fund a college degree is associated with having a lower net worth, a more complete financial profile suggests a bachelor’s degree does pay off in other ways, particularly in terms of household income. The typical household income of college-educated student debtors ($57,941) is nearly twice that of households whose heads do not have a bachelor’s degree ($32,528). And as a recent Pew Research report found, the income gap between today’s young college graduates and those without a college degree is much wider than it was for previous generations of young adults.
This analysis of student debt does not address the broader question of which factors may be leading student debtors to carry more overall debt. It may be the case that the burden of student debt makes it more difficult for young adults to gain financial traction in other areas of their lives. It may also be the case that with the rising share of young adults enrolling in college these days, economic gaps between those who borrow for college and those who do not may be widening.
Recent Pew Research Center survey findings echo the link between student debt and individual economic well-being.1 Among young adult college graduates, those who took out loans to finance their education are less satisfied overall with their personal financial situation than are those who did not borrow money for college. Young adults who borrowed for college are also less likely to see an immediate payoff for the investment they made in their education.
Student Debt and Other Types of Debt
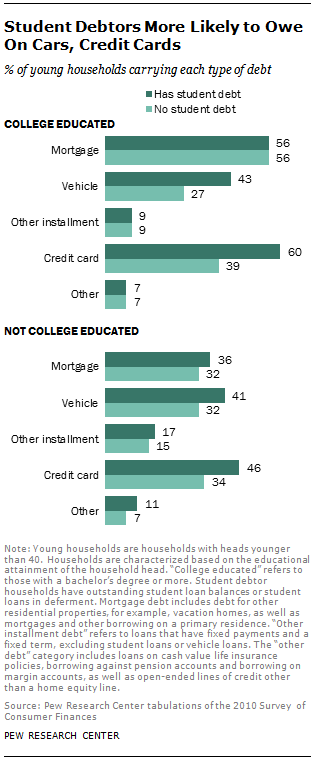
Comparing young households with similar levels of education, student debtors in many cases are more likely to owe other specific kinds of debts. For example, among college-educated households, student debtors are more likely to owe vehicle debt (43% vs. 27%) and credit card debt (60% vs. 39%). Though the differences are somewhat less dramatic, a similar pattern holds among less-educated young households.
Though student debtor households tend to have larger total debt loads, indebtedness needs to be assessed in the context of the household’s economic resources. In other words, households with greater income and assets may be able to take on more debt. Using the conventional total debt-to-income ratio, where debt is measured as a share of income, college-educated student debtors are by far the most indebted.2 The median college-educated student debtor has total debt equal to about two years’ worth of household income (205%). By comparison, college-educated households without student debt and less educated households with student debt have total debts on the order of one year’s worth of household income (108% and 100%, respectively).
Aggregate household debt among all households peaked in late 2008 in the aftermath of the financial crisis (Federal Reserve Bank of New York, 2014). The Survey of Consumer Finances shows that younger households were reducing their overall indebtedness at a faster clip than older households between 2007 and 2010 (Fry, 2013). This is very consistent with the large declines in homeownership among younger households since 2005 (Emmons and Noeth, 2014).
Even as younger households were outpacing their elders in total debt reduction, however, the outstanding volume of student debt rose over the course of the recession. By the end of 2009, student debt eclipsed credit card debt as the second-largest type of debt owed by American households, after mortgages.
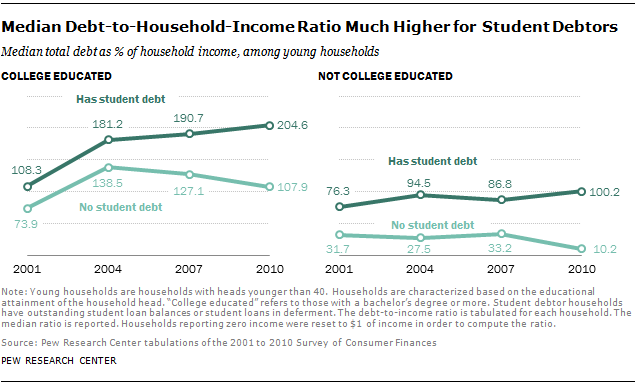
The puzzle of declining total indebtedness in the face of rising student loan debt can be resolved by examining debt burdens among younger households. Judged at the median, young households without student debt have indeed experienced declining debt burdens since 2007. For example, among college-educated households lacking student debt, the median debt-to-income ratio fell from 2007 (127%) to 2010 (108%). But the decline in indebtedness has not been uniform among young households. Debt-to-income ratios have tended to increase among student debtors, whether college educated or not.
The remainder of this report analyzes the economic well-being and satisfaction of young student debtors as well as their demographic characteristics. Section 1 presents the basic economic outcomes of student debtor households and looks at total indebtedness in the context of household income and assets. It concludes with recent Pew Research survey findings of young college graduates on their financial well-being. Section 2 turns to demographics and highlights the greater education and occupational prestige of young households owing student debt.
About the Data
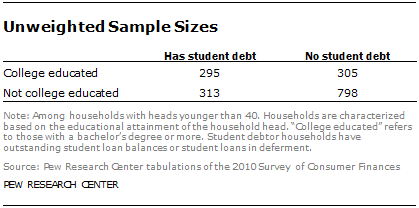
Findings in this report are based on the Survey of Consumer Finances (SCF), which is sponsored by the Federal Reserve Board of Governors and the Department of Treasury. It has been conducted every three years since 1983 and is designed to provide detailed information on the finances of U.S. households. The most recent data are from the 2010 SCF. A virtue of the SCF is that it has detailed demographic information on the head of the household. Additional detail on the collection and nature of the SCF is available in Bricker, et. al., 2012. The SCF sample typically consists of approximately 4,500 households, but the most recent survey included about 6,500 households. This report focuses on the finances of the 1,711 households whose heads are younger than 40. All results are appropriately weighted. By education and student debt status, the unweighted counts of young households are as follows:
Among the college educated, the mean age of the student debtors is about a year younger than households not owing student debt (30.8 vs. 31.9). Among households without at least a bachelor’s degree, student debtors are about 1.5 years younger on average (29.0 vs. 30.7).
A Note on Terminology
Throughout the report a “young household” or “young adult household” refers to a household headed by a person younger than 40 (including a small number of households with heads younger than 18).
Household characteristics are assigned on the basis of the characteristics of the head of the household.
A “college-educated” household refers to a household headed by a person whose highest education is a bachelor’s degree or more. A “not college-educated” household refers to a household headed by a person whose highest education is less than a bachelor’s degree.
A “student debtor” refers to a household owing outstanding education-related installment debt and includes loans that are currently in deferment as well as loans in their scheduled repayment period. The student debt of all household members is included in the household’s student debt.
“Net worth” and “wealth” are used interchangeably and refer to the difference between the value of assets owned by a household (such as home, stocks and savings accounts) and its liabilities (such as mortgages, credit card debt and loans for education).


