Every U.S. census since the first one in 1790 has included questions about racial identity, reflecting the central role of race in American history from the era of slavery to current headlines about racial profiling and inequality. But the ways in which race is asked about and classified have changed from census to census, as the politics and science of race have fluctuated. And efforts to measure the multiracial population are still evolving.
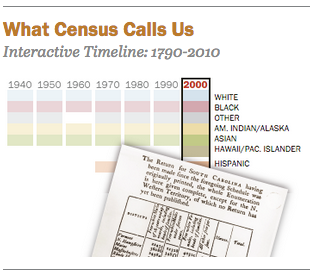
From 1790 to 1950, census takers determined the race of the Americans they counted, sometimes taking into account how individuals were perceived in their community or using rules based on their share of “black blood.” Americans who were of multiracial ancestry were either counted in a single race or classified into categories that mainly consisted of gradations of black and white, such as mulattoes, who were tabulated with the non-white population. Beginning in 1960, Americans could choose their own race. Since 2000, they have had the option to identify with more than one.
This change in census practice coincided with changed thinking about the meaning of race. When marshals on horseback conducted the first census, race was thought to be a fixed physical characteristic. Racial categories reinforced laws and scientific views asserting white superiority. Social scientists today generally agree that race is more of a fluid concept influenced by current social and political thinking.11
Along with new ways to think about race have come new ways to use race data collected by the census. Race and Hispanic origin data are used in the enforcement of equal employment opportunity and other anti-discrimination laws. When state officials redraw the boundaries of congressional and other political districts, they employ census race and Hispanic origin data to comply with federal requirements that minority voting strength not be diluted. The census categories also are used by Americans as a vehicle to express personal identity.12
The first census in 1790 had only three racial categories: free whites, all other free persons and slaves. “Mulatto” was added in 1850, and other multiracial categories were included in subsequent counts. The most recent decennial census, in 2010, had 63 possible race categories: six for single races and 57 for combined races. In 2010, 2.9% of all Americans (9 million) chose more than one racial category to describe themselves.13 The largest groups were white-American Indian, white-Asian, white-black and white-some other race.14
Some research indicates that using data from the current census race question to tally the number of multiracial Americans may undercount this population. An alternative is to use responses to the Census Bureau’s question about “ancestry or ethnic origin.” Here respondents are allowed to write in one or two responses (for example, German, Nicaraguan, Jamaican or Eskimo). These can then be mapped into racial groups. By this metric, 4.3% of Americans (more than 13 million) reported two-race ancestry in 2010-2012, an estimate that is about 70% larger than the 7.9 million who reported two races in answering the race question.15
The ancestry data also offer a longer time trend: A Pew Research analysis finds that the number of Americans with two different racial ancestries has more than doubled since 1980, when the ancestry question was first asked.
This chapter explores the history of how the U.S. decennial census has counted and classified Americans by race and Hispanic origin, with a particular focus on people of multiracial backgrounds, and examines possible future changes to the way race is enumerated in U.S. censuses. The chapter also examines the racial makeup and age structure of the nation’s multiracial population, based on the Census Bureau’s American Community Survey. The final section explores trends in the number and share of Americans who report two ancestries that have predominantly different racial compositions, also based on the Census Bureau’s American Community Survey. Readers should note that estimates here—as they are based on Census Bureau data—may differ from those derived from the Pew Research Center survey of multiracial Americans that will form the basis of the analysis for subsequent chapters of this report.
How the Census Asks About Race
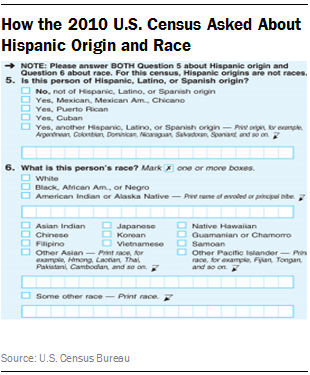
Currently census questionnaires ask U.S. residents about their race and Hispanic ethnicity using a two-question format. On the 2010 census form (and current American Community Survey forms), respondents are first asked whether they are of Hispanic, Latino or Spanish origin (and, if so, which origin—Mexican, Puerto Rican, Cuban or another Hispanic origin).
The next question asks them to mark one or more boxes to describe their race. The options include white, black, American Indian/Alaska Native, as well as national origin categories (such as Chinese) that are part of the Asian or Hawaiian/Pacific Islander races. People filling out the form may also check the box for “some other race” and fill in the name of that race. Explicit instructions on the form note that Hispanic/Latino identity is not a race.
Nonetheless, many respondents write in “Hispanic,” “Latino” or a country with Spanish or Latin roots, suggesting that the standard racial categories are less relevant to them.
This two-question format was introduced in 1980, the first year that a Hispanic category was included on all census forms. (See below for more on the history of how the Census Bureau has counted Hispanics.)
The option to choose more than one race, beginning in 2000, followed Census Bureau testing of several approaches, including a possible “multiracial” category. The change in policy to allow more than one race to be checked was the result of lobbying by advocates for multiracial people and families who wanted recognition of their identity. The population of Americans with multiple racial or ethnic backgrounds has been growing due to repeal of laws banning intermarriage, changing public attitudes about mixed-race relationships and the rise of immigration from Latin America and Asia. One important indicator is in the growth in interracial marriage: The share of married couples with spouses of different races increased nearly fourfold from 1980 (1.6%) to 2013 (6.3%).
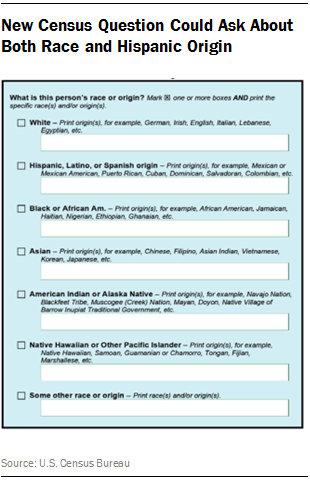
For the 2020 census, the Census Bureau is considering a new approach to asking U.S. residents about their race or origin. Beginning with the 2010 census, the bureau has undertaken a series of experiments trying out different versions of the race and Hispanic questions. The latest version being tested, as described below, combines the Hispanic and race questions into one question, with write-in boxes in which respondents can add more detail.
Counting Whites and Blacks
Through the centuries, the government has revised the race and Hispanic origin categories it uses to reflect current science, government needs, social attitudes and changes in the nation’s racial composition.16
For most of its history, the United States has had two major races, and until recent decades whites and blacks dominated the census racial categories.17 (American Indians were not counted in early censuses because they were considered to live in separate nations.) At first, blacks were counted only as slaves, but in 1820 a “free colored persons” category was added, encompassing about 13% of blacks.18
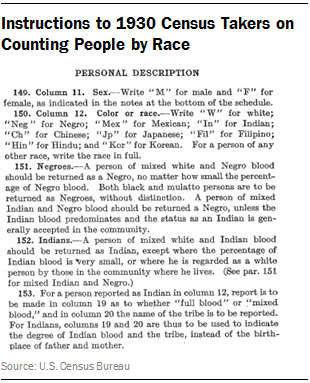
In a society where whites had more legal rights and privileges than people of other races, detailed rules limited who was entitled to be called “white” in the census. Until the middle of the 20th century, the general rule was that if someone was both white and any other non-white race (or “color,” as it was called in some early censuses), that person could not be classified as white. This was worded in various ways in the written rules that census takers were given. In the 1930 census, for example, enumerators were told that a person who was both black and white should be counted as black, “no matter how small the percentage of Negro blood,” a classification system known as the “one-drop rule.”19
Mulattos, Quadroons and Octoroons
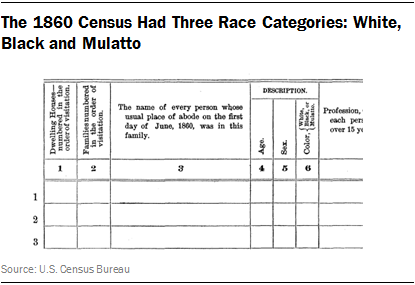
Some race scientists and public officials believed it was important to know more about groups that were not “pure” white or black. Some scientists believed these groups were less fertile, or otherwise weak; they looked to census data to support their theories.20 From the mid-19th century through 1920, the census race categories included some specific multiracial groups, mainly those that were black and white.
“Mulatto” was a category from 1850 to 1890 and in 1910 and 1920. “Octoroon” and “quadroon” were categories in 1890. Definitions for these groups varied from census to census. In 1870, “mulatto” was defined as including “quadroons, octoroons and all persons having any perceptible trace of African blood.” The instructions to census takers said that “important scientific results” depended on their including people in the right categories. In 1890, a mulatto was defined as someone with “three-eighths to five-eighths black blood,” a quadroon had “one-fourth black blood” and an octoroon had “one-eighth or any trace of black blood.”21
The word “Negro” was added in 1900 to replace “colored,” and census officials noted that the new term was increasingly favored “among members of the African race.”22 In 2000, “African American” was added to the census form. In 2013, the bureau announced that because “Negro” was offensive to many, the term would be dropped from census forms and surveys.
Although American Indians were not included in early U.S. censuses, an “Indian” category was added in 1860, but enumerators counted only those American Indians who were considered assimilated (for example, those who settled in or near white communities). The census did not attempt to count the entire American Indian population until 1890.
In some censuses, enumerators were told to categorize American Indians according to the amount of Indian or other blood they had, considered a marker of assimilation.23 In 1900, for example, census takers were told to record the proportion of white blood for each American Indian they enumerated. The 1930 census instructions for enumerators said that people who were white-Indian were to be counted as Indian “except where the percentage of Indian blood is very small, or where he is regarded as a white person by those in the community where he lives.”
Efforts to Categorize Multiracial Americans
In the 1960 census, enumerators were told that people they counted who were both white and any other race should be categorized in the minority race. People of multiracial non-white backgrounds were categorized according to their father’s race. There were some exceptions: If someone was both Indian and Negro (the preferred term at the time), census takers were told the person should be considered Negro unless “Indian blood very definitely predominated” and “the person was regarded in the community as an Indian.”
Some Asian categories have been included on census questionnaires since 1860—“Chinese,” for example, has been on every census form since then.24 The 1960 census also included, for the first and only time, a category called “Part Hawaiian,” which applied only to people living in Hawaii. It coincided with Hawaii’s admission as a state; a full Hawaiian category also was included. (The 1960 census was also the first after Alaska’s admission as a state, and “Eskimo” and “Aleut” categories were added that year.)
In most censuses, the instructions to enumerators did not spell out how to tell which race someone belonged to, or how to determine blood fractions for American Indians or for people who were black and white. But census takers were assumed to know their communities, especially from 1880 onward, when government-appointed census supervisors replaced the federal marshals who had conducted earlier censuses. In the 1880 census, emphasis was placed on hiring people who lived in the district they counted and knew “every house and every family.” However, enumerator quality varied widely.25
Despite repeatedly including multiracial categories, census officials expressed doubt about the quality of data the categories produced. The 1890 categories of mulatto, octoroon and quadroon were not on the 1900 census, after census officials judged the data “of little value and misleading.” Mulatto was added back in 1910 but removed again in 1930 after the data were judged “very imperfect.”26
In 1970, respondents were offered guidance on how to choose their own race: They were told to mark the race they most closely identified with from the single-race categories offered. If they were uncertain, the race of the person’s father prevailed. In 1980 and 1990, if a respondent marked more than one race category, the Census Bureau re-categorized the person to a single race, usually using the race of the respondent’s mother, if available. Beginning in 2000, although only single-race categories were offered, respondents were told they could mark more than one to identify themselves. This was the first time that all Americans were offered the option to include themselves in more than one racial category. That year, some 2.4% of all Americans (including adults and children) said they were of two or more races.
Among the major race groups, the option to mark more than one race has had the biggest impact on American Indians. The number of American Indians counted in the census grew by more than 160% between 1990 and 2010, with most of the growth due to people who marked Indian and one or more additional races, rather than single-race American Indians. But other researchers have noted that the American Indian population had been growing since 1960—the first year in which most Americans could self-identify—at a pace faster than could be accounted for by births or immigration. They have cited reasons including the fading of negative stereotypes and a broadened definition on the census form that may have encouraged some Hispanics to identify as American Indian.27
Census History of Counting Hispanics
It was not until the 1980 census that all Americans were asked whether they were Hispanic. The Hispanic question is asked separately from the race question, but the Census Bureau is now considering whether to make a recommendation to the Office of Management and Budget to combine the two.
Until 1980, only limited attempts were made to count Hispanics. The population was relatively small before passage of the 1965 Immigration and Nationality Act, which broadly changed U.S. policy to allow more visas for people from Latin America, Asia and other non-European regions. Refugees from Cuba and migrants from Puerto Rico also contributed to population growth.
Until 1930, Mexicans, the dominant Hispanic national origin group, had been classified as white. A “Mexican” race category was added in the 1930 census, following a rise in immigration that dated to the Mexican Revolution in 1910. But Mexican Americans (helped by the Mexican government) lobbied successfully to eliminate it in the 1940 census and revert to being classified as white, which gave them more legal rights and privileges. Some who objected to the “Mexican” category also connected it with the forced deportation of hundreds of thousands of Mexican Americans, some of them U.S. citizens, during the 1930s.28
In the 1970 census, a sample of Americans were asked whether they were of Mexican, Puerto Rican, Cuban, Central or South American, or other Spanish origin—a precursor of the universal Hispanic question implemented later. The 1980 census asked all Americans whether they were of “Spanish/Hispanic origin,” and listed the same national-origin categories except for “Central or South American.”29 The 2000 census added the word “Latino” to the question.
The addition of the Hispanic question to census forms reflected both the population growth of Hispanics and growing pressure from Hispanic advocacy groups seeking more data on the population. The White House responded to the pressure by ordering the secretary of commerce, who oversees the Census Bureau, to add a Hispanic question in 1970. A 1976 law sponsored by Rep. Edward Roybal of California required the federal government to collect information about U.S. residents with origins in Spanish-speaking countries.30 The following year, the Office of Management and Budget released a directive listing the basic racial and ethnic categories for federal statistics, including the census. “Hispanic” was among them.
The Hispanic category is described on census forms as an origin, not a race—in fact, Hispanics can be of any race. But question wording does not always fit people’s self-identity; census officials acknowledge confusion on the part of many Hispanics over the way race is categorized and asked about. Although Census Bureau officials have tinkered with wording and placement of the Hispanic question in an attempt to persuade Hispanics to mark a standard race category, many do not. In the 2010 census, 37% of Hispanics—18.5 million people—said they belonged to “some other race.” Among those who answered the race question this way in the 2010 census, 96.8% were Hispanic. And among those Hispanics who did, 44.3% indicated on the form that Mexican, Mexican American or Mexico was their race, 22.7% wrote in Hispanic or Hispano or Hispana, and 10% wrote in Latin American or Latino or Latin.31
Possible New Combined Race-Hispanic Question
Leading up to the 1980 census, the Census Bureau tested a new approach to measuring race and ethnicity that combined standard racial classifications with Hispanic categories in one question. But at the time, the bureau didn’t seriously consider using this approach for future censuses.32 That option is on the table again, however, because of concerns that many Hispanics and others have been unsure how to answer the race question on census forms.33 In the 2010 census, the nation’s third-largest racial group is Americans (as noted above, mainly Hispanics) who said their race is “some other race.” The “some other race” group, intended to be a small residual category, outnumbers Asians, American Indians and Americans who report two or more races.
The Census Bureau experimented during the 2010 census with a combined race and Hispanic question asked of a sample of respondents. The test question included a write-in line where more detail could be provided. The bureau also tried different versions of the two-question format.
Census Bureau officials have cited promising results from their Alternative Questionnaire Experiment. According to the results, the combined question yielded higher response rates than the two-part question on the 2010 census form, decreased the “other race” responses and did not lower the proportion of people who checked a non-white race or Hispanic origin. The white share was lower, largely because some Hispanics chose only “Hispanic” and not a race.
However, fewer people counted themselves in some specific Hispanic origin groups (“Mexican,” for example) when those groups were not offered as check boxes. Some civil rights advocacy groups have expressed concern that the possible all-in-one race and Hispanic question could result in diminished data quality. According to a recent report from the Leadership Conference on Civil and Human Rights, “Civil rights advocates are cautiously optimistic about the possibility of more accurate data on the Latino population from revised 2020 census race and ethnicity question(s), but they remain concerned about the possible loss of race data through a combined race and Hispanic origin question, the diminished accuracy of detailed Hispanic subgroup data, and the ability to compare data over time to monitor trends.”34
The bureau is continuing to experiment with the combined question, with plans to test it on the Current Population Survey this year and on the American Community Survey in 2016. Any questionnaire changes would need approval from the Office of Management and Budget, which specifies the race and ethnicity categories on federal surveys. Congress also will review the questions the Census Bureau asks, and can recommend changes. The Census Bureau must submit topic areas for the 2020 census to Congress by 2017 and actual question wording by 2018.
Census Data on Multiracial Americans
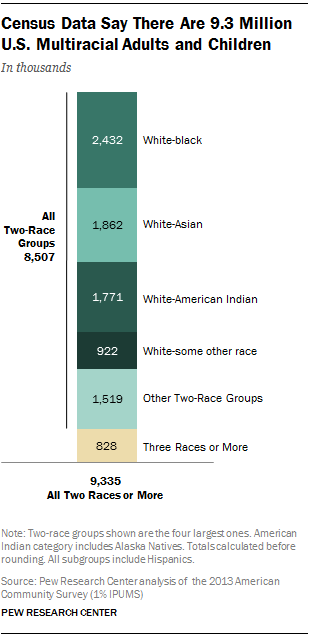
Based on the Census Bureau’s American Community Survey, the nation’s multiracial population stood at 9.3 million in 2013, or 3% of the population. This number is based on the current census racial identification question and comprises 5 million adults and 4.3 million children. Among all multiracial Americans, the median age is 19, compared with 38 for single-race Americans.
The four largest multiracial groups, in order of size, are those who report being white and black (2.4 million), white and Asian (1.9 million), white and American Indian (1.8 million) and white and “some other race” (922,000).35 White and black Americans are the youngest of these groups, with a median age of only 13. Those who are white and American Indian have the oldest median age, 31. These four groups account for three-quarters of multiracial Americans.
The four largest multiracial groups are the same for both adults and children, but they rank in different order. Among multiracial adults, the largest group is white and American Indian (1.3 million). That is followed by white and Asian (921,000) and white and black (900,000). Those who are white and “some other race” number 539,000. Fully 25% of multiracial adults in 2013 also said they were Hispanic, compared with 15% of single-race adults.
Among Americans younger than 18, the groups rank in the same order as for multiracial Americans overall: white and black (1.5 million), white and Asian (941,000), white and American Indian (518,000) and white and “some other race” (383,000).
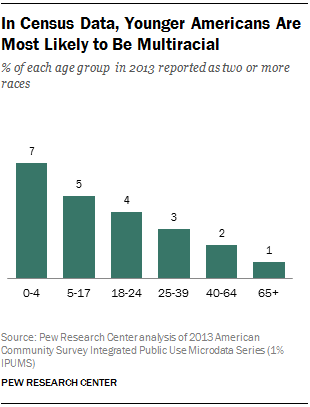
The nation’s overall multiracial population tilts young. Americans younger than 18 accounted for 23% of the total population in 2013, but they were 46% of the multiracial population. The younger the age group, the higher its share of multiracial Americans. Of those younger than 18, 6% are of more than one race, compared with about 1% of Americans age 65 and older. Among all adults, 2.1% are of more than one race. (In filling out census forms, parents report both their own race and that of their children.)
A more detailed analysis of the demographic characteristics of adults with multiracial backgrounds, based on the Pew Research survey, appears in Chapter 2.
Trends in Two-Race Ancestry
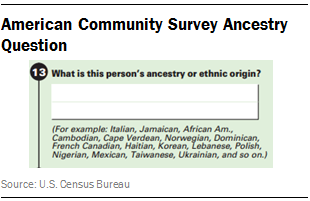
Another way to analyze the multiracial population in the U.S. involves responses to the census question about ancestry or ethnic origin. Because Americans have been asked about their ancestry since 1980, their responses provide more than three decades of data on change in the size of the U.S. population with two races in their background. By comparison, data on multiracial Americans from the race question have been available only since 2000, when people were first allowed to identify themselves as being of more than one race.
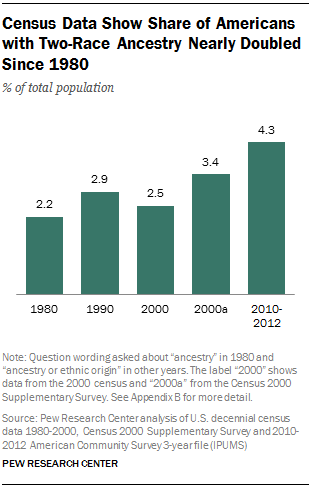
This analysis is based on Americans of all ages, not just adults. The Census Bureau reports up to two ancestry responses per person, most of which a Pew Research Center analysis matched to standard racial categories reflecting the dominant race in a given country of origin. For example, people in the 2010-2012 American Community Surveys who said they have ancestral roots in Germany would be classified as white, because over 99% of people of German ancestry said they were white when answering the race question on that same survey.36 Using this method yields a larger estimate of the U.S. two-race population than is obtained from using responses to the race question: 13.5 million compared with 7.9 million in the 2010-2012 American Community Survey.37
The analysis indicates that the U.S. population of two-race ancestry has more than doubled in size, from about 5.1 million in 1980 to 13.5 million in 2012. The share of the U.S. population with two-race ancestry has nearly doubled, from 2.2% in 1980 to 4.3% in 2010-2012. By comparison, the total U.S. population has grown by a little more than a third over the same period.