It’s hard to talk about race. Fear of saying the wrong thing, fear of expressing an unpopular view or simply the fear of offending others can dampen honest conversations about racial attitudes.
Accurately measuring racial attitudes faces another formidable obstacle. Psychologists say that biased racial views are sometimes buried deep in a person’s subconscious – the byproducts of exposure to popular culture, the media and other factors.
To overcome these obstacles, Pew Research Center conducted an Implicit Association Test (IAT), a technique that psychologists say measures subconscious or “hidden” bias by tracking how quickly individuals associate good and bad words with specific racial groups.
The country is becoming more diverse and the multiracial population is growing, trends with significant implications for race relations. Pew Research Center used the IAT to explore the extent to which single-race whites, blacks and Asians have a subconscious bias for or against their own or another race, and whether similar biases exist among biracial adults. Decades of IAT testing has generally showed that most humans display a bias against out-groups – people who are different from them. The question this study sought to answer is whether multiracial adults are less likely to have those biases, or simply more divided in their racial preferences. The answer, fairly definitively, turns out to be the latter.
To test for hidden racial biases, Pew Research Center conducted an online Implicit Association Test (IAT) with single-race whites, blacks and Asians, as well as biracial white and Asian and white and black adults.
The IAT measures automatic associations between two words or concepts. Psychologists say individuals are quicker to categorize words or concepts they believe to be linked, for example “candy” with “sweet,” rather than “candy” with “bitter.”
In the case of the Pew Research Center IAT, the test measured differences in how quickly subjects were able to correctly categorize positive and negative words or the photos of black and white or white and Asian men. By varying the test conditions, the IAT measures, in theory, the degree to which individuals automatically and subconsciously view one race more positively or negatively than the other. Social scientists who conduct IAT studies claim that the test is a more accurate way to detect ingrained racial bias than self-reports in traditional surveys.
Researchers caution that the IAT is not a “racism test” nor does it measure overt racial prejudice. Racial prejudice is a set of explicit beliefs that an individual knowingly holds. The IAT produces an indirect measure of subconscious racial preferences that a person might be dismayed to learn they harbor.
Overall the test found that about three-quarters of respondents in each of the five racial groups, including those who are biracial, demonstrated some degree of implicit racial bias. Across the groups, only about 20% to 30% of those in the study were found to have little or no bias toward the races they were tested against. (Note: Because the pool of adults from which these samples were drawn is not representative of the adult population, the results of this study should be viewed as exploratory. See Appendix A: Methodology)
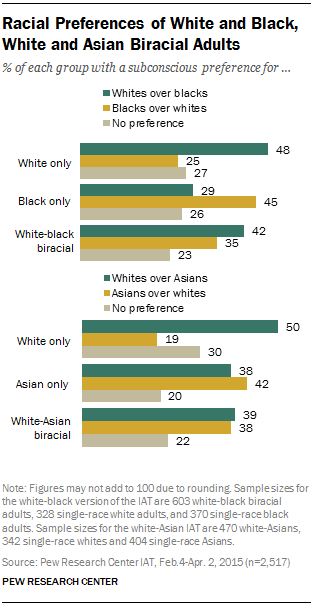
The study found wide variation in racial preferences within each of the five test groups.1 For example, while pluralities of whites and blacks were biased in favor of their own racial group, the same was not true among single-race Asians, who were more evenly divided in their subconscious preferences.
Single-race Asians were about as likely to show a bias for whites over Asians (38%) as they were to regard Asians more favorably than whites (42%). The remaining 20% did not clearly favor one race over the other.
By contrast, fully half of all single-race whites preferred whites over Asians, or more than double the share (20%) that preferred Asians. Three-in-ten whites favored neither race over the other.

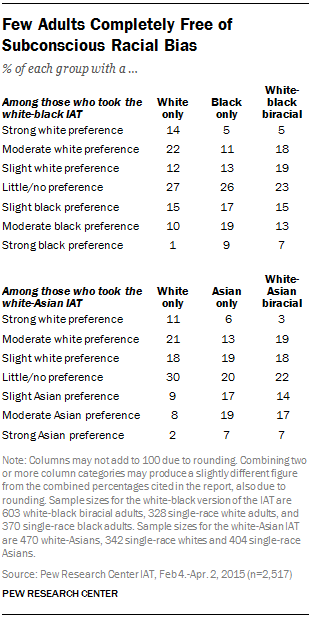
The experiment also found that about half of all single-race whites in the Pew Research Center test automatically preferred whites over blacks (48%), including about a third (35%) who favored whites moderately to strongly. A quarter of all whites demonstrated an implicit bias for blacks, and a similar share (27%) was race-neutral.
Among single-race blacks, 45% were quicker to associate positive words with blacks and negative words with whites, including 28% with a moderate or strong automatic preference for blacks.
An additional 29% of single-race blacks favored whites, while 26% were race-neutral. (Single-race blacks and white and black biracial adults were not tested for bias against Asians. Asians and biracial white and Asian adults were not tested for bias against blacks.)
Two different but equally striking patterns emerged when the analysis turned to the level of bias among the two biracial groups. First, few biracial adults are race-neutral: Only 23% of white and black biracial adults and 22% of white and Asian biracial adults have little or no bias.
Second, in contrast to the lopsided pluralities of whites and blacks who favored their own race, biracial white and black adults were more evenly divided: 42% favored whites over blacks – including 23% who had a moderate or strong implicit preference for whites and 19% with a slight preference. At the same time, about a third (35%) preferred blacks.
A third pattern emerged from the results of those whose racial background includes both white and black ancestry: Their levels of bias look much more like those of white respondents than those of black respondents. According to the test, fully 42% of all white and black biracial adults had a pro-white bias, just short of the 48% of all whites that felt the same way2 and 7 percentage points higher than the share with a pro-black bias (35%).
Biracial white and Asian adults were even more divided in their subconscious racial preferences. Much like single-race Asians, about four-in-ten (39%) biracial white and Asian adults favored whites, while 38% preferred Asians.
Unlike traditional public opinion polls, which often find clear differences in racial tolerance between many key demographic groups, the Pew Research Center study found that most adults in the test samples subconsciously favored one race over another. Roughly equal levels of implicit racial bias were found among men and women, old and young, and college educated and those with a high school diploma or less formal schooling. Republicans and Democrats with the same racial background also had similar levels of underlying racial bias.
The results of the Pew Research Center IAT race experiment are similar in many respects to previous IAT studies. Data from the race IAT on the “Project Implicit”3 website have consistently found that most whites demonstrate a clear bias for whites and against blacks; this is consistent with the Pew Research Center findings on single-race whites. While the Pew Research Center data suggests that blacks demonstrate bias for blacks and against whites, the Project Implicit data suggests that blacks are more evenly divided.4
Testing for Racial Preferences
To measure racial bias toward blacks, whites and Asians, Pew Research Center conducted an online Implicit Association Test. Study participants were drawn from the YouGov online panel and asked to complete the IAT on their home computers. A sample of 370 single-race blacks and 603 white and black biracial adults took an IAT measuring bias toward whites and blacks. A total of 404 single-race Asians and 470 biracial white and Asian adults were assigned to take an IAT comparing whites and Asians. A sample of 670 single-race whites were randomly assigned to take either the white-black or white-Asian IAT.
Following the practice of researchers who conduct race studies of this type, only those Asians who were from or whose family was originally from East Asia or the Pacific Rim were included in the single-race Asian and biracial white and Asian groups. Those countries included China, South Korea, Japan, Vietnam, Thailand and the Philippines. About three-quarters of all Asians in the United States trace their ancestry to one or more of the East Asian or the Pacific Rim countries. Asians who trace their families back to a West Asian country – India, Pakistan, Sri Lanka and Bangladesh – were not included in the samples of Asians or white and Asian biracial adults.
According to U.S. Census figures, white and black biracial adults constituted 0.6% of the U.S. population in 2010, and white and Asian biracial adults made up 0.5%. Because of the practical difficulties of sampling populations this small, the techniques used to obtain the samples of the five racial groups differ from those used in other Pew Research Center national surveys.
For this study, the samples were drawn from the YouGov panel, which is composed of approximately 1.5 million adults nationally who have volunteered to take surveys. Each sample was adjusted to match census figures for each group in terms age, gender and education, as well as to match other surveys on characteristics such as voter registration and party affiliation. Because the panel from which these samples were drawn is not representative of the adult population as a whole, both in that not everyone has the internet and that the panelists are not randomly selected, the results of this study should not be compared with the results of other Pew Research Center surveys that use probability-based sampling techniques, including the recent Multiracial in America report.
In the experiment, white and black biracial adults, single-race blacks and half the single-race white sample were tested for bias against blacks and whites. White and Asian biracial adults, single-race Asians and the other half of the white sample were tested for bias against whites and Asians.
The participants were asked to sort a series of photos and words into two categories. The names of the categories appeared at the top of the screen. Half the time the categories were “African American” and “good.” On the other half of the tests, the categories were “white American” and “good.” For the white-Asian version of the test, the words “Asian American” or “white American” appeared at the top of the screen along with the word “good.”
Below the category and in quick succession, a word appeared that was synonymous for “good” or “bad,”5 or the photo of a young black or a white man (or a photo of a young Asian or a white man). These words or images were the “targets” to be sorted. Participants had to correctly identify whether the word or image they saw was a synonym for the category word “good” or whether it was a photo of a member of the racial group listed at the top of the page. The time it took participants to correctly match the word or photo with the right category was carefully measured and recorded.
These reaction times, expressed as a summary statistical measure called a “D score,” became the raw data used to analyze the results. The test is based on decades of psychological research findings that people are quicker to associate words or images together that are consistent with their internal beliefs, such as “flower” and “pretty,” and less quick to associate concepts they view as dissimilar, such as “flower” and “ugly.”6 In the Pew Research Center test, people who subconsciously favored whites over blacks would be expected to take less time to correctly match the picture of a white man with the category “white American” than to correctly match the picture of a black man with the category “African American” when the word “good” also appeared on the screen.
Measuring Racial Preferences
Reaction-time data for participants were used to determine subconscious bias toward the races they were tested against. Participants were grouped into seven categories based on their reaction times. For example, in the white-black version of the test, participants were sorted by their scores into those who showed a “strong” preference for whites, a “moderate” preference for whites, a “slight” preference for whites, “little or no” preference for either group, and a “slight,” “moderate” or “strong” preference for blacks. Results of the white-Asian version of the test were categorized in a similar fashion.
The categories were based on a widely used scoring scale developed by psychology professor Brian Nosek of the University of Virginia, a pioneer in the use of the IAT to measure subconscious racial bias.7 Overall the experiment found that most people in the five racial groups had some degree of bias toward the races they were tested against.
In the white-black version of the IAT, about a quarter of white and black biracial adults (23%) were found to have little or no preference for either blacks or whites, virtually identical to the shares of single-race whites (27%) and single-race blacks (26%) who were race-neutral.
The results were similar for the white-Asian version of the experiment: 22% of white and Asian biracial adults, 30% of single-race whites and 20% of single-race Asians had no clear preference for whites or Asians.
Demographic Differences
Apart from some large differences by racial group, the Pew Research Center experiment suggests that automatic racial preferences for one race are roughly shared equally by men and women, the old and young, as well as college graduates and those with less education.
For example, among single-race whites, about half of all men (50%) and about the same share of women (46%) favored whites over blacks.8 Single-race black men and women were the mirror-opposite of whites: Identical shares of black men and women (45% for both) were quicker to associate positive words with blacks and negative words with whites. Among white and black biracial adults, roughly a third of men (35%) and women (34%) favored blacks, while 45% of men and 39% of women preferred whites, a difference that was not statistically significant.
While some studies have shown that younger adults are more likely to express racially tolerant views,9 the IAT experiment suggests a somewhat different story. Younger and older adults, regardless of their racial background, were found to have similar levels of underlying racial bias. Half of single-race whites younger than 40 favored, to varying degrees, whites over blacks – and so did 47% of those 40 and older.10 Similarly, 42% of younger single-race blacks and 46% of those 40 and older showed a preference for blacks.
Among biracial white and black adults, 42% of those 39 and younger and 43% of those 40 and older preferred whites over blacks. About a third of younger (35%) and older adults (34%) in this group favored blacks. The remainder had no preference for either race over the other.
Similarly, no significant differences by level of education were found. Across the three racial groups in the white and black IAT, roughly equal shares of those with a college degree (a group that included those with a two-year college degree) and those with less formal education expressed similar levels of racial bias.
When it comes to biases toward Asians and whites, the findings of the demographic analysis were less consistent. No clear differences by age, gender and education emerged among single-race Asians and white and Asian biracial adults. But among single-race whites, men were more likely than women to favor whites over Asians (60% vs. 40%). At the same time, 57% of single-race whites with a two-year college degree or more education favored whites over Asians, compared with 46% of those with less formal schooling, a difference that falls just short of being statistically significant at the 95% confidence level.
To further explore the relationship between demographics and racial bias, a multivariate linear regression analysis was conducted to assess the independent impact of race, gender, age and education on IAT scores,11 all other factors being equal.
This analysis offered a more nuanced view of the relationship between demographics and IAT scores. Race remained the single strongest predictor of IAT scores, but, among those who took the white and black IAT, younger adults ages 18 to 29 were slightly more likely than older adults to prefer whites to blacks, other factors being equal.
In the white-Asian test the regression findings for education were mixed. While having a two-year college degree or more education was not a significant predictor of IAT scores, when the sample was divided into those with at least a four-year college degree and those with less education, the analysis suggests that better educated adults have a slightly more favorable view of whites than those who did not graduate from a four-year college.
When party identification was added to the analysis, it proved not to be statistically significant: Democrats and Republicans were found to have roughly similar levels of racial bias in both versions of the IAT, all other factors held constant. In that case, too, race proved to be the strongest predictor of IAT scores.
Explicit vs. Implicit Measures of Bias
After completing the IAT, participants took a short survey that included questions often used in traditional public opinion polls to measure racial prejudice. Consistent with other studies, the Pew Research Center analysis found little or no relationship between IAT scores and the results of these explicit measures of racial bias. In other words, respondents with higher levels of racial bias were about as likely as those with lower levels to give unbiased – or biased – answers to survey questions.
One series of questions measured belief in racial stereotypes. Respondents were asked how well six phrases described whites, blacks and Asians. Three phrases reflected a positive stereotype: “self-reliant,” “value work over pleasure” and “high achievers in school.” Three were cast in the negative: “insist on special privileges,” “lack good moral values” and “involved in drugs and gangs.”
Respondents could answer that the phrase described the racial group “very well,” “fairly well,” “not too well” or “not at all well.” These answers were then scored on a four-point numeric scale that ranged from zero to three. A score of zero indicated the most positive answer and three the most negative. For example, someone who responded that the phrase “lack good moral values” described whites “very well” would be coded as three; their answer would be coded as two if they said it described whites “fairly well,” as one if they answered “not too well” and zero if they said “not well at all.” The scoring was reversed when the phrase reflected a positive stereotype. For example, those who said the phrase “high achievers in school” described whites “very well” would be given a zero, while someone who said it described whites “not well at all” would get a three, indicating a negative view of whites.
Each respondent’s answers to the six questions were then totaled to form a racial stereotype scale that ranged from zero for those who consistently offered the most positive evaluation of the target race to 18 for those who consistently had the most negative responses and somewhere in between if their answers varied.
A regression analysis was then conducted to see how closely IAT scores were correlated with the scores on the racial stereotype scale. In both the white-black and white-Asian versions of the experiment, the scores on the IAT did not predict scores on the racial stereotype scale once the independent effects of gender, age, education and racial group were accounted for in the analysis. The same pattern emerged when the analysis was reversed: Scores in the stereotype scale did not predict an individual’s IAT score after age, gender, education and race were held constant.
These findings are broadly consistent with other studies comparing explicit and implicit measures of racial attitudes. A research team headed by psychologist Brian Nosek of the University of Virginia found in an experiment conducted with visitors to a website that blacks demonstrated a stronger preference for blacks over whites on the explicit measure but a weak preference for whites on the IAT. Whites had an automatic preference for whites over blacks on the IAT but a significantly weaker preference for their own race on a standard survey question testing explicit racial preferences.12
In a direct comparison between IAT scores and explicit measures of racial bias, a research team headed by Stanford professor Shanto Iyengar, a consultant on the Pew Research Center IAT experiment, that “the number of respondents classified as prejudiced on the implicit measure substantially exceeds the corresponding number based on explicit indicators.”
Does the IAT Predict Behavior?
Social scientists judge the value of a test such as the IAT by its ability to predict how people will act. In the case of the race IAT, the question becomes: Do IAT scores predict differences in how people treat people of different races?
In a number of studies, researchers have found that the IAT predicted a range of race-based behaviors.13 Alexander R. Green of Harvard Medical School led a research team that found doctors’ IAT scores predicted their attitudes toward their black and white heart patients and the treatment decisions they made.14 Specifically Green found that the IAT “revealed implicit preference favoring white Americans…and implict stereotypes of black Americans as less cooperative with medical procedures…and less cooperative generally.” The researchers also found that “as physicians’ pro-white implicit bias increased, so did their likelihood of treating white patients and not treating black patients with thrombolysis,” a procedure used to dissolve dangerous blood clots. Other researchers have found that anti-black implicit attitudes of white freshmen who had been randomly assigned a black roommate predicted the success of the roommate relationship.15
A Swedish researcher found that implicit measures of anti-Muslim stereotypes among Swedish hiring managers predicted the decision to interview Swedes over Arab and Muslim job applicants.16 Moreover, the study reported that the IAT performed better than explicit measures of racial attitudes in predicting who would be interviewed for a job.
Other tests also have found that the IAT is useful in detecting views that individuals may be reluctant to divulge to others or even to admit to themselves. In one striking example, researchers used an IAT that measured an implicit sexual preference for adults or children to distinguish convicted pedophiles from other violent offenders.17
Researchers caution that no social science test can perfectly predict racial prejudice or other antisocial behaviors. After reviewing 122 research reports, MahzarinR. Banaji and Anthony G. Greenwald, who first developed the IAT, conclude that “IAT scores correlated moderately with discriminatory judgments and behavior.”18 Their study also found that the IAT predicted racially biased behaviors “significantly more effectively than did the types of question-asking measures that have long been used in studies of prejudice.”19
The findings presented in this report are primarily based on the results of an Implicit Association Test. The test measures how long people take to associate positive and negative words with different racial groups. The combined result for each participant is summarized in a statistic called a “D score.” In this report the D score is referred to as the “IAT score” or “IAT effect score.”
Following the practice of social scientists who have used the race IAT in their research, the terms “bias,” “preference” and “automatic preference” are used interchangeably in this report.
The single-race white, black and Asian samples do not include Hispanics. Biracial white and black and white and Asian adults are no other races and not Hispanic.


