
For updated findings on views about racial inequality in the U.S., see “Amid National Reckoning, Americans Divided on Whether Increased Focus on Race Will Lead to Major Policy Change.”
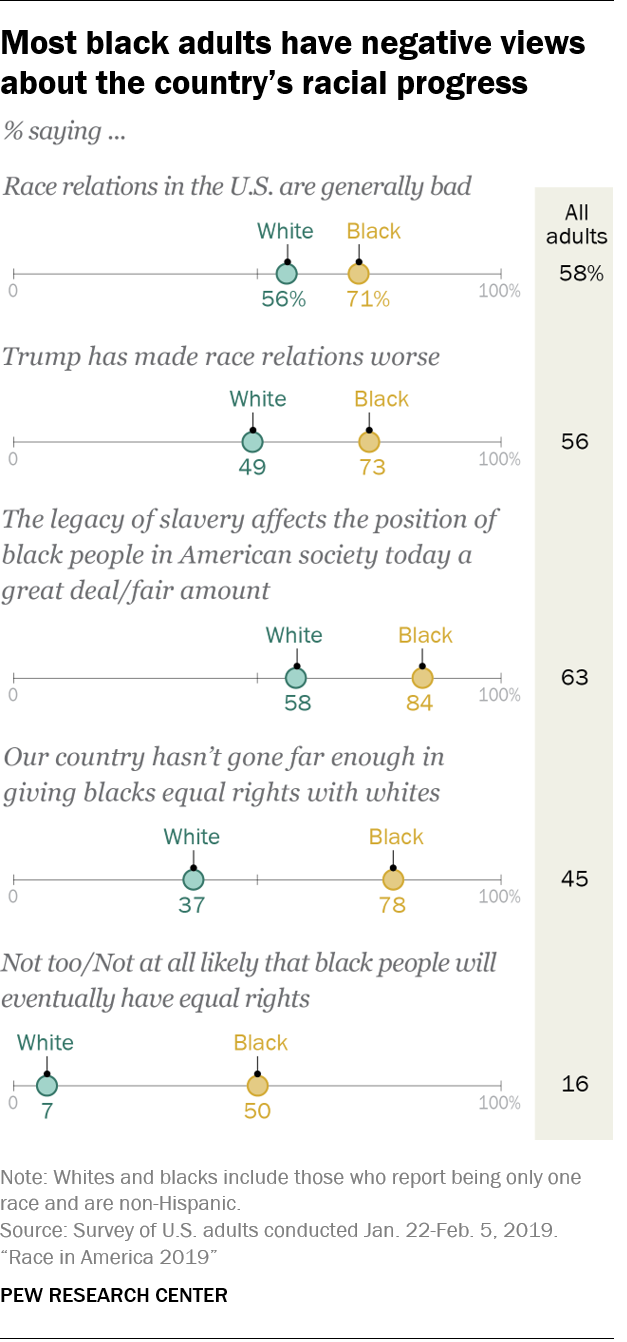
More than 150 years after the 13th Amendment abolished slavery in the United States, most U.S. adults say the legacy of slavery continues to have an impact on the position of black people in American society today. More than four-in-ten say the country hasn’t made enough progress toward racial equality, and there is some skepticism, particularly among blacks, that black people will ever have equal rights with whites, according to a new Pew Research Center survey.
Opinions about the current state of race relations – and President Donald Trump’s handling of the issue – are also negative. About six-in-ten Americans (58%) say race relations in the U.S. are bad, and of those, few see them improving. Some 56% think the president has made race relations worse; just 15% say he has improved race relations and another 13% say he has tried but failed to make progress on this issue. In addition, roughly two-thirds say it’s become more common for people to express racist views since Trump became president.
Blacks are particularly gloomy about the country’s racial progress. More than eight-in-ten black adults say the legacy of slavery affects the position of black people in America today, including 59% who say it affects it a great deal. About eight-in-ten blacks (78%) say the country hasn’t gone far enough when it comes to giving black people equal rights with whites, and fully half say it’s unlikely that the country will eventually achieve racial equality.
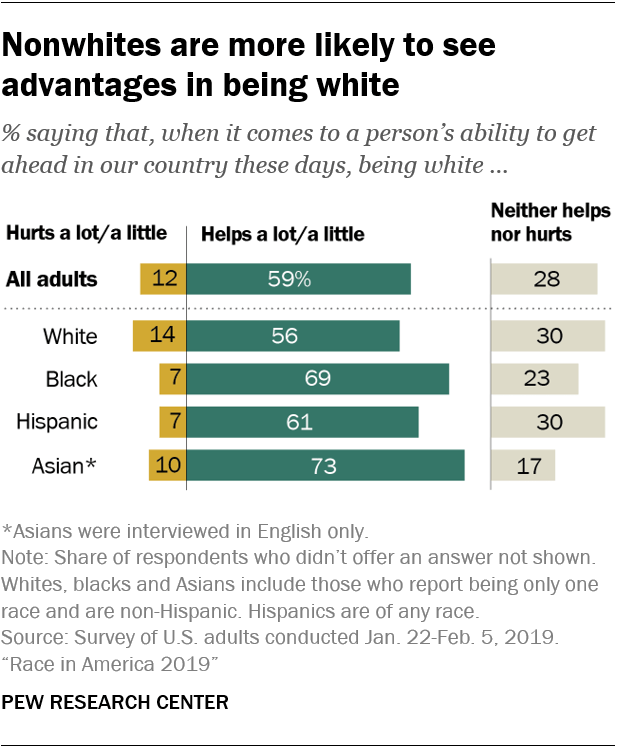
Americans see disadvantages for blacks and Hispanics in the U.S. A majority of all adults (56%) say being black hurts people’s ability to get ahead at least a little, and 51% say the same about being Hispanic. In contrast, 59% say being white helps people’s ability to get ahead. Views about the impact of being Asian or Native American are more mixed.
Blacks, Hispanics and Asians are more likely than whites to say being white helps people’s ability to get ahead at least a little. Among whites, those who are more educated, as well as those who identify with or lean toward the Democratic Party, are particularly likely to see advantages to being white.
The nationally representative survey of 6,637 adults was conducted online Jan. 22-Feb. 5, 2019, in English and Spanish, using Pew Research Center’s American Trends Panel.1 In addition to exploring the public’s views about the state of race relations and racial inequality in America, the survey also looks at personal experiences with racial and ethnic discrimination and the role race plays in people’s lives. Among the report’s key findings:
Most Americans say it’s now more common for people to express racist or racially insensitive views; more than four-in-ten say it’s more acceptable
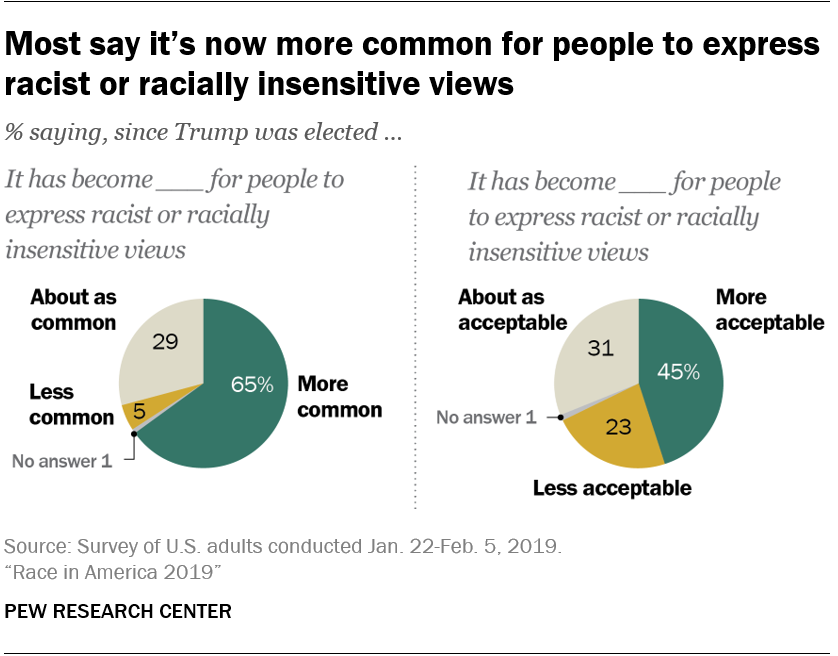
Most Americans (65%) – including majorities across racial and ethnic groups – say it has become more common for people to express racist or racially insensitive views since Trump was elected president. A smaller but substantial share (45%) say this has become more acceptable.
Democrats and those who lean Democratic are more likely than Republicans and Republican leaners to say it has become more common and more acceptable for people to express racist and racially insensitive views since Trump was elected president. Among Democrats, 84% say this is now more common and 64% say it’s more acceptable; fewer than half of Republicans say it has become more common (42%) and just 22% say it has become more acceptable for people to express these types of views.
Views of Trump’s handling of race relations are far more negative than views of how Obama handled the issue
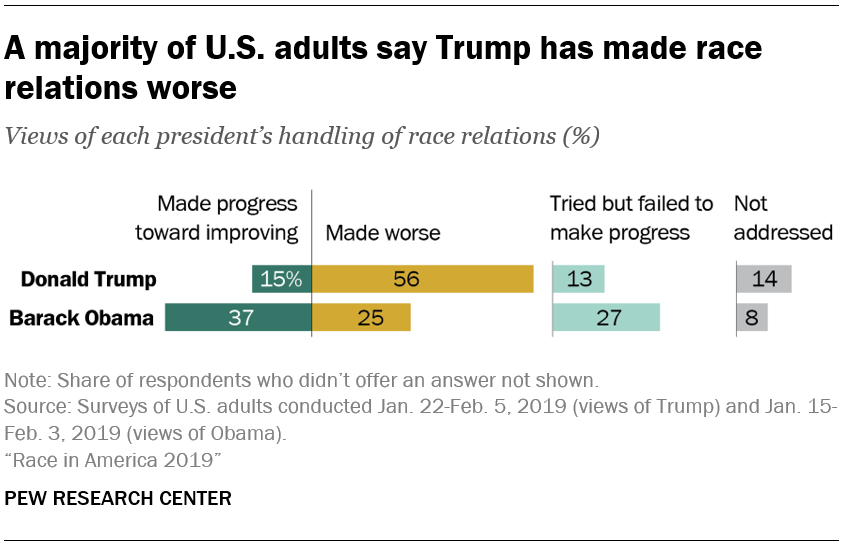
A majority of Americans (56%) say Trump has made race relations worse; just 15% say he has made progress toward improving race relations, while 13% say he has tried but failed to make progress and 14% say he hasn’t addressed this issue. In contrast, 37% say Barack Obama made progress on race relations when he was president, and 27% say he tried but failed.2 A quarter of Americans say Obama made race relations worse. These retrospective views of Obama’s handling of race relations are nearly identical to views expressed during Obama’s last year in office.
Not surprisingly, assessments of Trump’s and Obama’s handling of race relations differ considerably along partisan lines. Democrats overwhelmingly say Trump has made race relations worse (84%), including large shares of black (79%) and white (86%) Democrats. Views are more divided among Republicans. About a third of Republicans (34%) say Trump has improved race relations and 25% say he has tried but failed to make progress; 19% of Republicans say he hasn’t addressed the issue, while 20% say he has made race relations worse.
When it comes to views of Obama’s handling of race relations, 55% of Democrats say he improved race relations during his presidency; just 8% say he made things worse. In contrast, 51% of Republicans say Obama made race relations worse, while 14% say he made progress toward improving it. As is the case with views of Trump’s handling of race relations, white and black Democrats offer somewhat similar assessments of how Obama handled this issue when he was president.
Republicans and Democrats have vastly different views on race
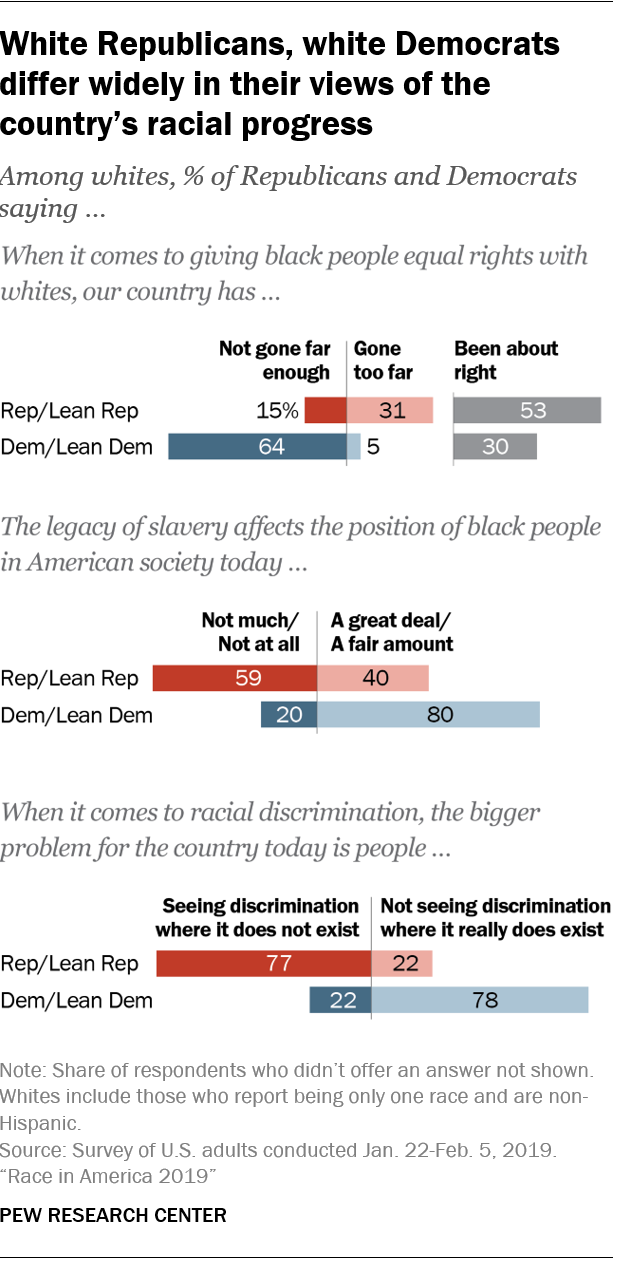
In addition to being linked to views of Trump’s handling of race relations, partisanship is strongly associated with racial attitudes more broadly. In fact, after controlling for other factors, partisanship has a greater association with views about the country’s racial progress than demographic factors, though being young and more educated are also significant predictors, particularly among whites.3
Because whites and nonwhites often have widely different views of racial issues, and nonwhites disproportionately identify with or lean to the Democratic Party, gaps between Republicans and Democrats are often shown among whites in this report in order to account for differences in the racial composition of the two parties.4
White Democrats (64%) are far more likely than white Republicans (15%) to say the country hasn’t gone far enough when it comes to giving black people equal rights with whites. About half of Republicans say it’s been about right, while a sizable minority (31%) says the country has gone too far in this regard.
Eight-in-ten white Democrats – vs. 40% of white Republicans – say the legacy of slavery continues to have an impact on black people’s position in American society today. And when it comes to views about racial discrimination, 78% of white Democrats say the bigger problem is people not seeing it where it really does exist, while a similar share of white Republicans say people seeing racial discrimination where it really does not exist is the bigger problem.
Blacks are more likely than other groups to say their race has had a negative impact on their ability to get ahead; whites are the most likely to say their race helped them
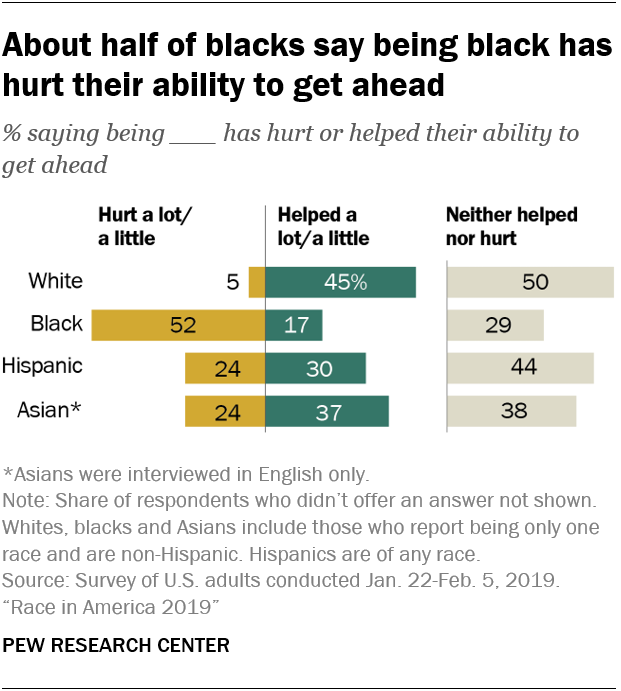
About half of black adults (52%) say being black has hurt their ability to get ahead at least a little, with 18% saying it has hurt a lot. About a quarter of Hispanics and Asians (24% each) and just 5% of whites say their race or ethnicity has had a negative impact. In turn, whites are more likely than other groups to say their racial background has helped them at least a little.
Among blacks, those with at least some college experience are more likely than those with less education to say being black has hurt their ability to get ahead.
Education is also linked with whites’ perceptions of the impact their race has had on their ability to get ahead. Small shares of whites across educational levels say their racial background has hurt their ability to succeed, but those with a bachelor’s degree are more likely than those with less education to say being white helped them at least a little.
Across all racial and ethnic groups, more point to their own hard work than to any other attribute, including their race, their gender, the people they know or their family’s financial situation, as something that helped them get ahead.
Blacks, whites differ in assessments of why it may be harder for black people to get ahead
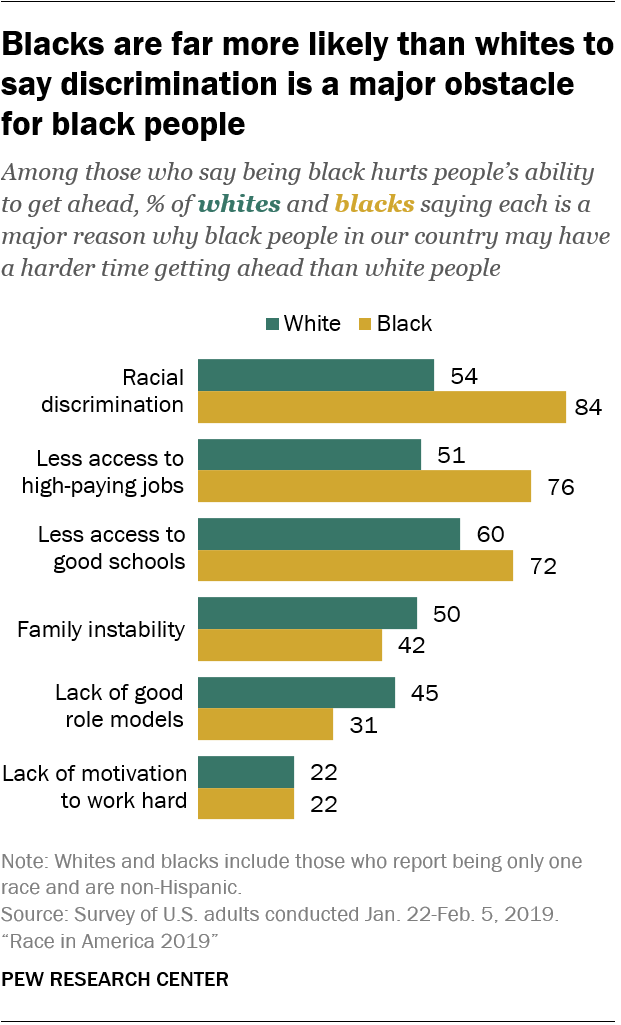
Whether or not they see their race as an obstacle for them personally, about two-thirds of blacks (68%) say being black generally hurts a person’s ability to get ahead in the country; 55% of whites say the same.
Among those who say being black hurts a person’s ability to get ahead, blacks are far more likely than whites to point to racial discrimination, less access to high-paying jobs and less access to good schools as major reasons why this is the case. In turn, whites are more likely than blacks to point to family instability and lack of good role models as major obstacles for black people. The same shares in both groups (22%) say a lack of motivation to work hard is to blame.
There are wide partisan gaps in these views. Most white Democrats who say being black hurts a person’s ability to succeed point to racial discrimination (70%) and less access to good schools (75%) or high-paying jobs (64%) as major reasons for this (among black Democrats, the shares are 86%, 74% and 78%, respectively). By comparison, about a third or fewer white Republicans say these are major obstacles for blacks. White Republicans are more likely than white Democrats to cite family instability, lack of good role models and a lack of motivation to work hard.
Majorities of black and white adults say blacks are treated less fairly than whites in dealing with police and by the criminal justice system
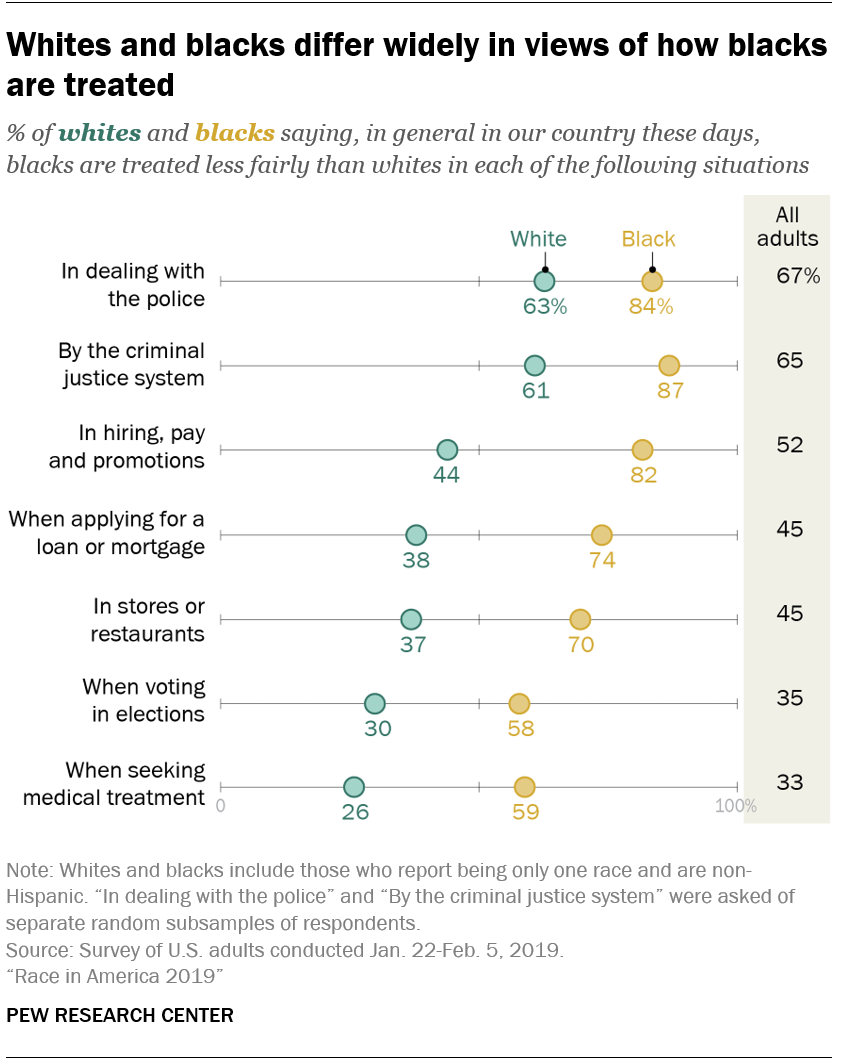
Black and white adults have widely different perceptions of how blacks are treated in America, but majorities of both groups say blacks are treated less fairly than whites by the criminal justice system (87% of blacks vs. 61% of whites) and in dealing with police (84% vs. 63%, respectively).
About six-in-ten blacks or more – but fewer than half of whites – say blacks are treated less fairly than whites in hiring, pay and promotions; when applying for a loan or mortgage; in stores or restaurants; when voting in elections; and when seeking medical treatment. In each of these realms, whites tend to say blacks and whites are treated about equally; very small shares say whites are treated less fairly than blacks.
Across these different areas, there are gaps ranging from 39 to 53 percentage points in how white Democrats and white Republicans see the treatment of blacks in the U.S. About half or more white Democrats say blacks are treated less fairly than whites in dealing with the police (88% vs. 43% of white Republicans); by the criminal justice system (86% vs. 39%); in hiring, pay and promotions (72% vs. 21%); when applying for a mortgage or loan (64% vs. 17%); in stores or restaurants (62% vs. 16%); when voting in elections (60% vs. 7%); and when seeking medical treatment (48% vs. 9%).
In some of these areas, black and white Democrats express similar views, but larger shares of black Democrats say black people are treated less fairly than whites in employment situations (86%), when applying for a loan or mortgage (78%), in stores or restaurants (73%), and when seeking medical treatment (61%).
Most Americans, including similar shares of whites and blacks, say it’s never acceptable for a white person to use the N-word
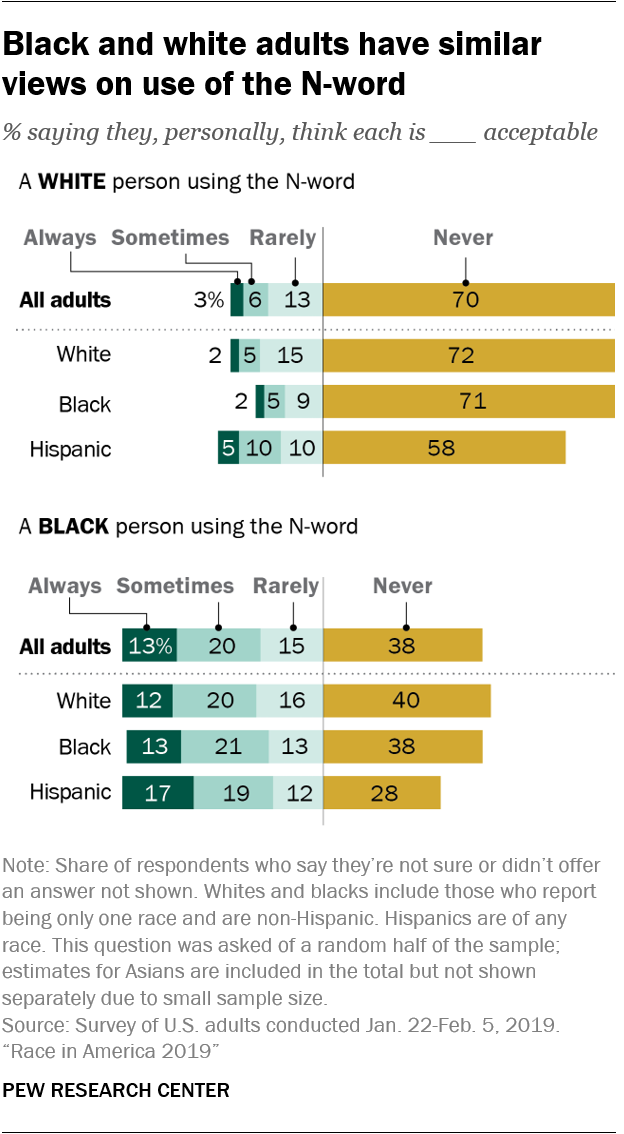
Seven-in-ten U.S. adults say they, personally, think it’s never acceptable for a white person to use the N-word; 13% say this is rarely acceptable and about one-in-ten say it is always (3%) or sometimes (6%) acceptable for a white person to use the N-word. Roughly seven-in-ten whites and blacks say this is never acceptable.
A smaller share of Hispanics (58%) say it’s never acceptable for a white person to use the N-word, but this is driven in part by the relatively large share of foreign-born Hispanics (28%) who say they are not sure whether it’s acceptable for a white person to use the N-word. Among Hispanics born in the U.S., 67% say this is never acceptable.
When it comes to black people using the N-word, about four-in-ten adults – including similar shares of blacks and whites – say they, personally, think it is never acceptable; 15% say it is rarely acceptable and about a third say it’s always (13%) or sometimes (20%) acceptable for black people to use the N-word.
Most black adults say being black is extremely or very important to how they think about themselves
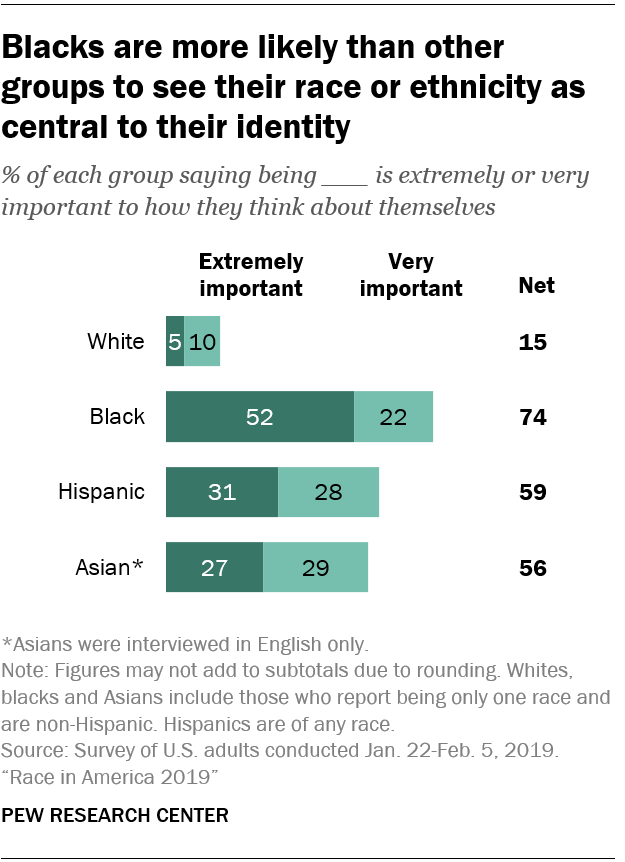
Blacks are more likely than Hispanics or Asians – and much more likely than whites – to say that their race is central to their identity. About three-quarters of black adults say being black is extremely (52%) or very (22%) important to how they think of themselves; 59% of Hispanics and 56% of Asians say being Hispanic or Asian, respectively, is at least very important to their overall identity, with about three-in-ten in each group saying it’s extremely important. In contrast, just 15% of whites say being white is very or extremely important to how they think of themselves; about two-thirds say it’s either only a little important (18%) or not important at all (47%).
Whites and blacks younger than 30 are less likely than their older counterparts to say their race is at least very important to their overall identity. Some 64% of black adults ages 18 to 29 say being black is at least very important, compared with roughly three-quarters or more among older age groups. And while relatively few whites across age groups say being white is central to how they think about themselves, whites younger than 30 are among the least likely to say so.
Among Hispanics, those born abroad are more likely than those born in the U.S. to say being Hispanic is at least very important to how they think of themselves (65% vs. 52%).
Majorities of blacks, Hispanics and Asians say they have experienced discrimination because of their race or ethnicity
About three-quarters of blacks and Asians (76% of each) – and 58% of Hispanics – say they have experienced discrimination or have been treated unfairly because of their race or ethnicity at least from time to time. In contrast, about two-thirds of whites (67%) say they’ve never experienced this.
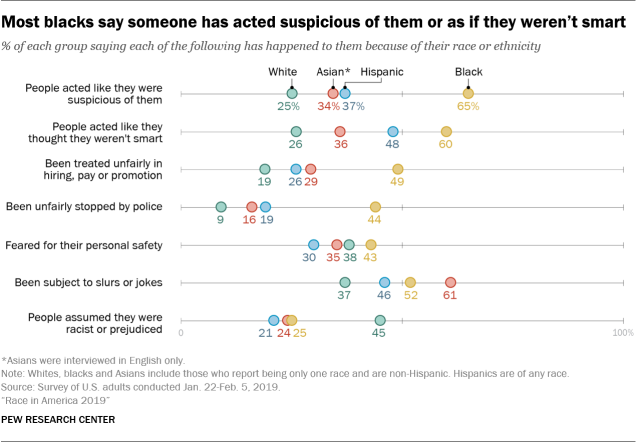
When asked about specific situations they may have experienced because of their race or ethnicity, blacks are considerably more likely than whites, Hispanics or Asians to say that people have acted as if they were suspicious of them; people have acted as if they thought they weren’t smart; they have been treated unfairly by an employer in hiring, pay or promotion; or they have been unfairly stopped by police. Hispanics and Asians are more likely than whites to say each of these have happened to them.
Asians are more likely than any other group to say they have been subject to slurs or jokes because of their race or ethnicity. In turn, more whites than blacks, Hispanics or Asians say people have assumed they were prejudiced or racist; 45% of whites have had this experience.
For Hispanics, skin color is associated with experiences with discrimination
The survey asked black and Hispanic respondents to identify the skin tone that best resembles their own using a modified version of the Massey-Martin scale.5 A multivariate analysis suggests that Hispanics with darker skin tones are more likely than those with lighter skin to say they have ever experienced discrimination or been treated unfairly because of their race or ethnicity.6 Darker skin color is also associated with a higher likelihood among Hispanics of saying that – because of their race or ethnicity – people have acted as if they were suspicious of them, people have acted as if they thought they weren’t smart, they have been treated unfairly in employment situations, they have subject to slurs or jokes, and that they have feared for their safety.
Among blacks, those with darker skin tones are more likely to say they have experienced racial discrimination generally, but skin color is not necessarily associated with having faced specific situations because of their race or ethnicity. In fact, for blacks, being male and having higher levels of education are more consistently associated with the specific forms of discrimination asked about in the survey.
A note about the Asian sample
This survey includes an oversample of Asian respondents, for a total sample size of 332 Asians. The sample includes English-speaking Asians only and, therefore, may not be representative of the overall U.S. Asian population (66% of our weighted Asian sample was born in another country, compared with 78% of the U.S. Asian adult population overall).
Despite this limitation, it is important to report the views of Asians on race relations and racial inequality, as well as their personal experiences with racial discrimination, as the U.S. Asian population is growing faster than any other major racial or ethnic group. Measuring the attitudes of Asians on these topics is an important piece in understanding the state of race in America today.
As always, Asians’ responses are incorporated into the general population figures throughout this report; data are weighted to be representative of the U.S. adult population as a whole. Asians are shown as a separate group when the question was asked of the full sample. Because of the relatively small sample size and a reduction in precision due to weighting, results are not shown separately for Asians for questions that were only asked of a random half of respondents (Form 1/Form 2) or some filtered questions. We are also not able to analyze Asian respondents by demographic categories, such as gender, age or education.
Terminology
References to whites, blacks and Asians include only those who are non-Hispanic and identify as only one race. Hispanics are of any race.
All references to party affiliation include those who lean toward that party: Republicans include those who identify as Republicans and independents who say they lean toward the Republican Party, and Democrats include those who identify as Democrats and independents who say they lean toward the Democratic Party.
References to college graduates or people with a college degree comprise those with a bachelor’s degree or more. “Some college” includes those with an associate degree and those who attended college but did not obtain a degree. “High school” refers to those who have a high school diploma or its equivalent, such as a General Education Development (GED) certificate.
Foreign born refers to people born outside of the United States, Puerto Rico or other U.S. territories to parents neither of whom was a U.S. citizen, regardless of legal status.
U.S. born refers to individuals who are U.S. citizens at birth, including people born in the United States, Puerto Rico or other U.S. territories, as well as those born elsewhere to parents who were U.S. citizens.
This report has been corrected to address an error in the classification of Asian respondents. In this corrected report, Asian estimates are based on 332 respondents who self-identified as Asian or Asian American only. An earlier version of this report provided Asian estimates based on 355 respondents, which properly included the 332 single-race Asian respondents but also included 23 respondents who identified as Native Hawaiian or other Pacific Islander or both Asian and Native Hawaiian or other Pacific Islander. This correction did not affect any of the substantive conclusions of the study. Some estimates for Asians changed by 1 to 3 percentage points.


