Roughly half of non-retired adults say the economic consequences of the coronavirus outbreak will make it harder for them to achieve their financial goals

Pew Research Center conducted this study to better understand Americans’ financial outlooks and how their personal financial situations have changed amid the coronavirus outbreak. For this analysis, we surveyed 10,334 U.S. adults in January 2021. Everyone who took part is a member of the Center’s American Trends Panel (ATP), an online survey panel that is recruited through national, random sampling of residential addresses. This way, nearly all U.S. adults have a chance of selection. The survey is weighted to be representative of the U.S. adult population by gender, race, ethnicity, partisan affiliation, education and other categories. Read more about the ATP’s methodology.
Here are the questions used for this report, along with responses, and its methodology.
References to those who have experienced job or wage loss include those who say they or someone in their household has been laid off (including temporarily) or furloughed or taken a pay cut since the coronavirus outbreak began in February 2020.
References to White, Black and Asian adults include only those who are not Hispanic and identify as only one race. Hispanics are of any race.
All references to party affiliation include those who lean toward that party. Republicans include those who identify as Republicans and those who say they lean toward the Republican Party. Democrats include those who identify as Democrats and those who say they lean toward the Democratic Party.
References to college graduates or people with a college degree comprise those with a bachelor’s degree or more. “Some college” includes those with an associate degree and those who attended college but did not obtain a degree.
“Middle income” is defined here as two-thirds to double the median annual family income for panelists on the American Trends Panel. “Lower income” falls below that range; “upper income” falls above it. See the methodology for more details.
References to disabled adults include those who say a disability or handicap keeps them from fully participating in work, school, housework or other activities.
About a year since the coronavirus recession began, there are some signs of improvement in the U.S. labor market, and Americans are feeling somewhat better about their personal finances than they were early in the pandemic. Still, about half of non-retired adults say the economic impact of the coronavirus outbreak will make it harder for them to achieve their long-term financial goals, according to a new Pew Research Center survey. Among those who say their financial situation has gotten worse during the pandemic, 44% think it will take them three years or more to get back to where they were a year ago – including about one-in-ten who don’t think their finances will ever recover.
The economic fallout from COVID-19 continues to hit some segments of the population harder than others. Lower-income adults, as well as Hispanic and Asian Americans and adults younger than 30, are among the most likely to say they or someone in their household has lost a job or taken a pay cut since the outbreak began in February 2020.1 Among those who’ve had these experiences, lower-income and Black adults are particularly likely to say they have taken on debt or put off paying their bills in order to cover lost wages or salary.
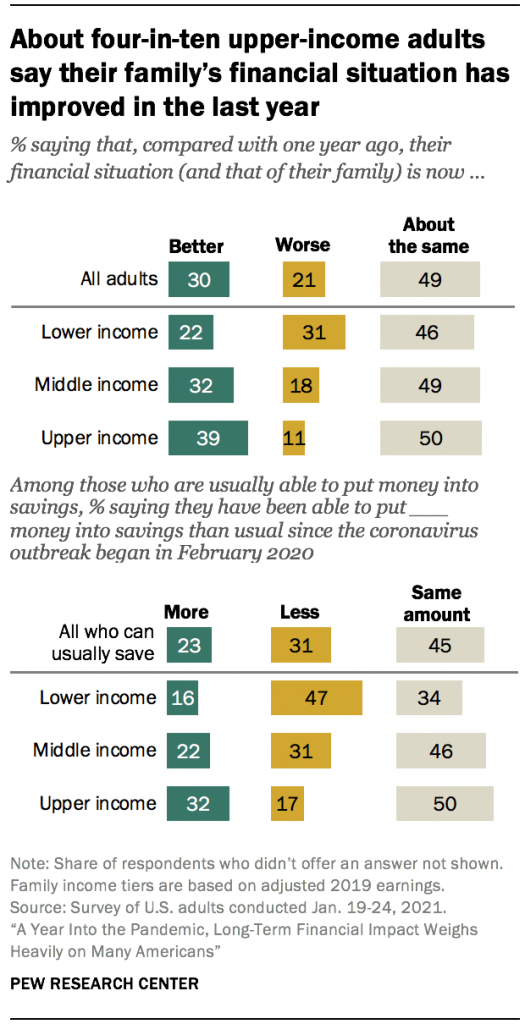
Adults with upper incomes have fared better. About four-in-ten (39%) say their family’s financial situation has improved compared with a year ago; 32% of those with middle incomes and just 22% of lower-income adults say the same. Upper-income adults are also more likely than those with middle or lower incomes to say they have been spending less and saving more money since the coronavirus outbreak began. (Family incomes are based on 2019 earnings.)
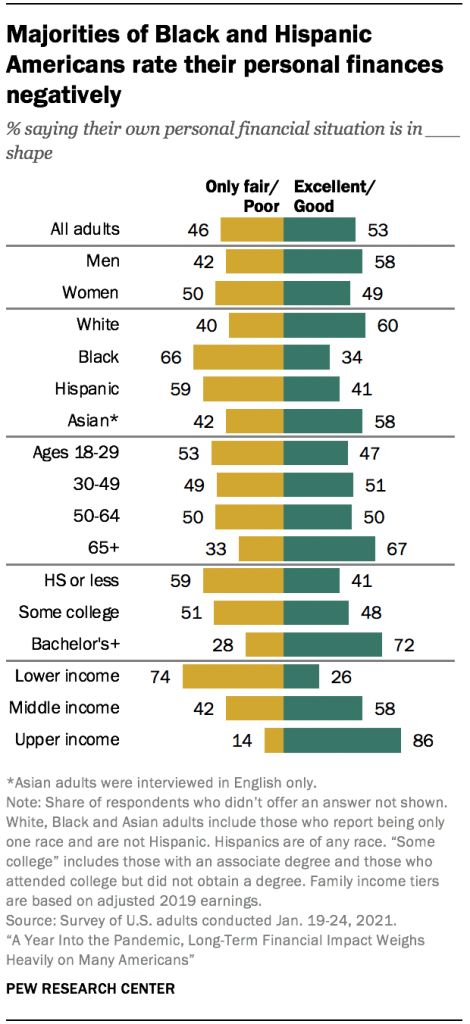
Overall, 53% of U.S. adults now rate their personal financial situation as excellent or good, up from 47% in April 2020, when the U.S. economy was in a virtual freefall. More than eight-in-ten upper-income adults (86%) and 58% of those with middle incomes say their finances are in excellent or good shape, as do about six-in-ten or more adults with at least a four-year college degree, White and Asian adults, men, and adults ages 65 and older. In contrast, about three-quarters of lower-income adults (74%) and majorities of Black and Hispanic adults and those with a high school diploma or less education say their personal finances are in only fair or poor shape.
Upper-income and middle-income adults, who saw declines in their personal financial ratings from August 2019 to April 2020, are now about as likely as they were before the coronavirus outbreak to say their personal finances are in excellent or good shape. Personal financial ratings have been more stable among lower-income adults.
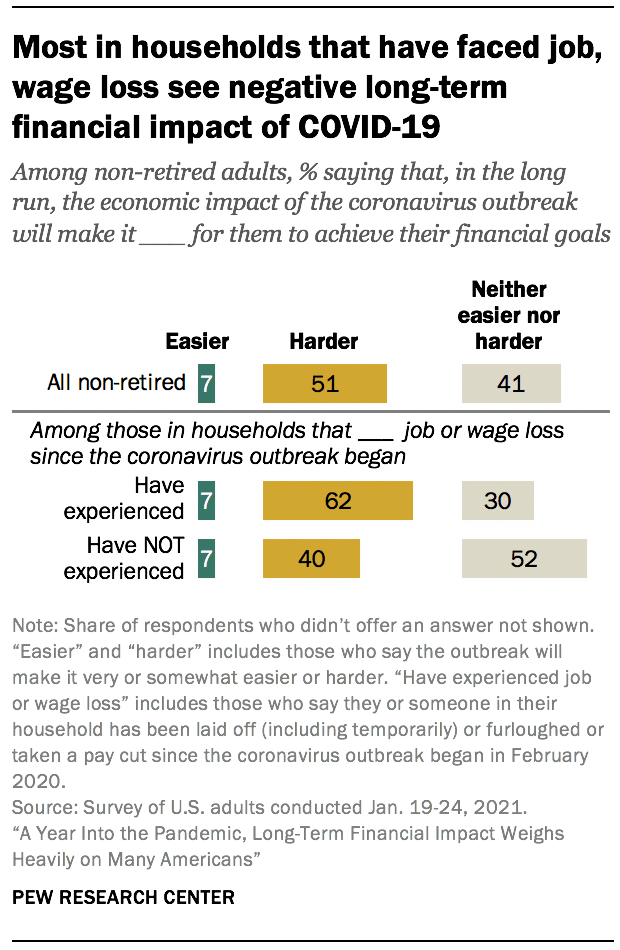
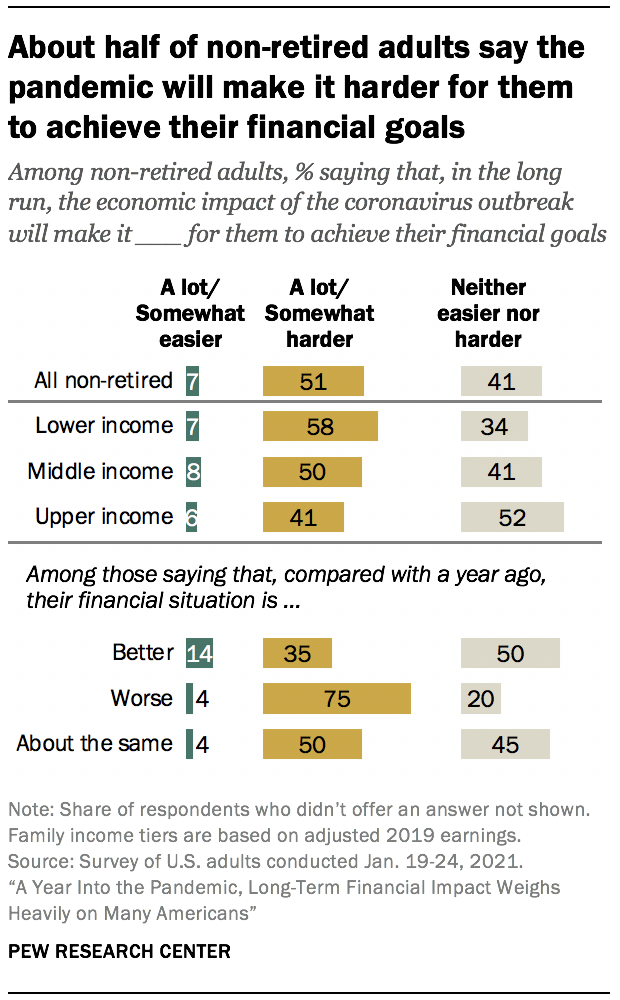
Looking ahead, about half of non-retired adults (51%) say the economic impact of the coronavirus outbreak will make achieving their long-term financial goals harder. Just 7% say the economic impact of the pandemic will make it easier and 41% say it’ll be neither easier nor harder for them to achieve their financial goals in the long run. Among those in households that experienced job or wage loss since the outbreak began, 62% say the economic impact of the pandemic will make it harder for them to achieve their financial goals, compared with four-in-ten of those who haven’t had these experiences.
The nationally representative survey of 10,334 U.S. adults was conducted Jan. 19-24, 2021, using the Center’s American Trends Panel.2 Among the other key findings:
The way Americans are planning to use payments from the coronavirus aid package varies considerably by income. Among those who have received or expect to receive a payment from the federal government as part of the aid package, 66% of lower-income adults say they are most likely to use the majority of the money to pay bills or for something essential they or their family need; smaller shares of those with middle (49%) and upper (30%) incomes plan to use the money this way. About a third of those with upper incomes (35%) say they will likely put the money into savings.
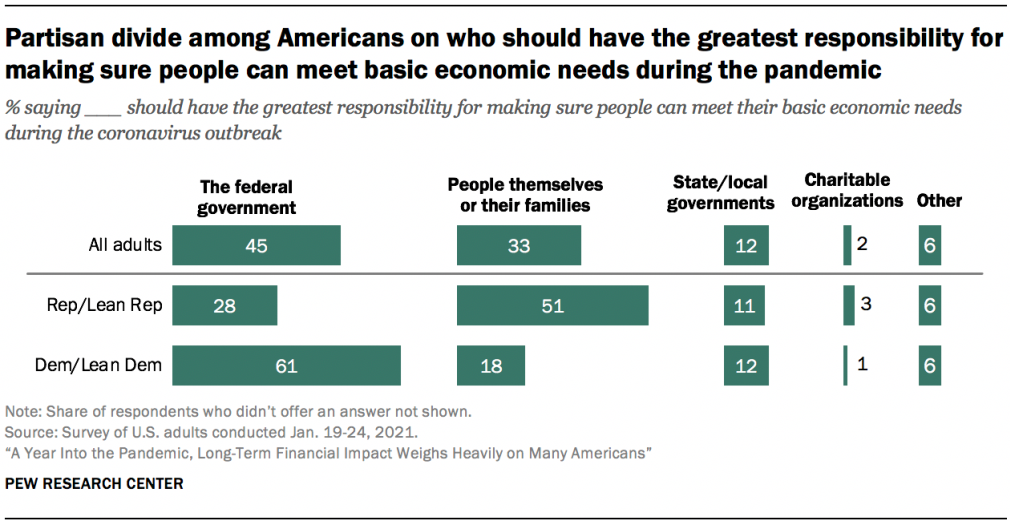
There’s no clear consensus among Americans on who should be responsible for making sure people can meet their basic economic needs during the pandemic. Some 45% say the federal government should have the greatest responsibility, while a third point to people themselves or their families. Smaller shares say state or local governments (12%), charitable organizations (2%) or another source (6%) should have the greatest responsibility to do this. These views vary widely across party lines. About six-in-ten Democrats and Democratic leaners (61%) say the federal government should be mostly responsible for making sure people can meet their basic economic needs during the coronavirus outbreak, compared with 28% of Republicans and those who lean to the GOP. In turn, 51% of Republicans (vs. 18% of Democrats) say people themselves or their families should have this responsibility.
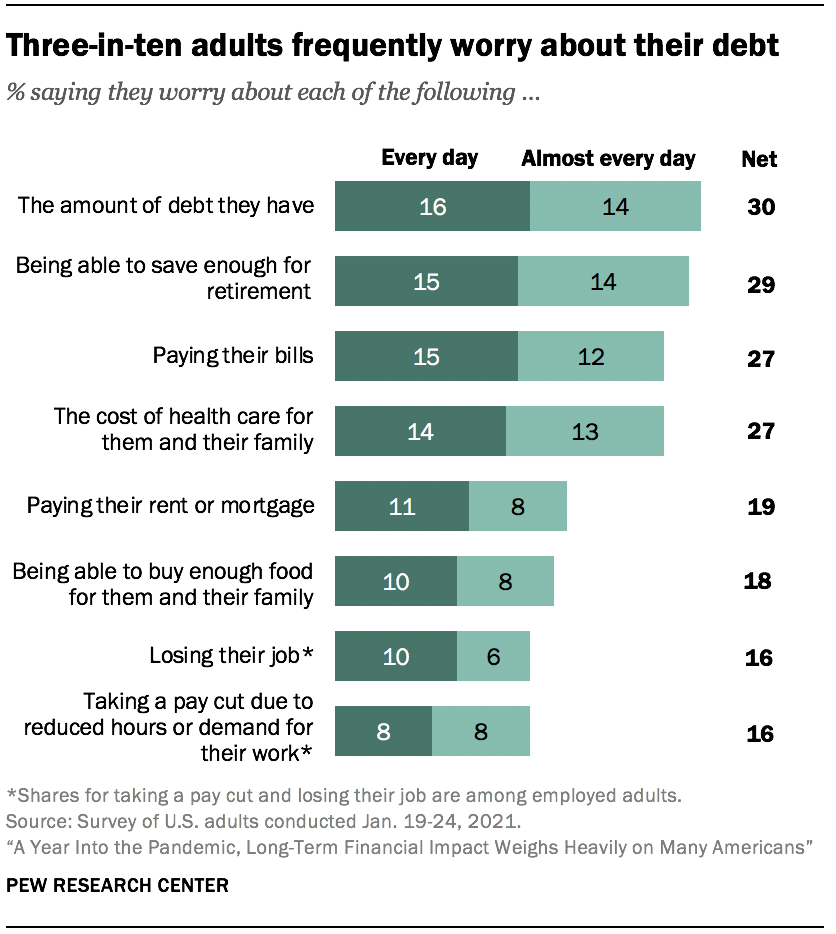
Financial concerns are less pressing than earlier in the pandemic, but many Americans remain worried about meeting some basic needs. About three-in-ten U.S. adults say they worry every day or almost every day about the amount of debt they have (30%) and their ability to save for retirement (29%). Roughly a quarter say they frequently worry about paying their bills (27%) and the cost of health care for them and their family (27%), and about one-in-five say they worry at least almost every day about paying their rent or mortgage (19%) or being able to buy enough food (18%). These concerns are felt more acutely by lower-income adults, as well as by those in households that have experienced job loss or pay cuts during the pandemic. Black and Hispanic adults are more likely than White adults to say they worry about each of these every day or almost every day.
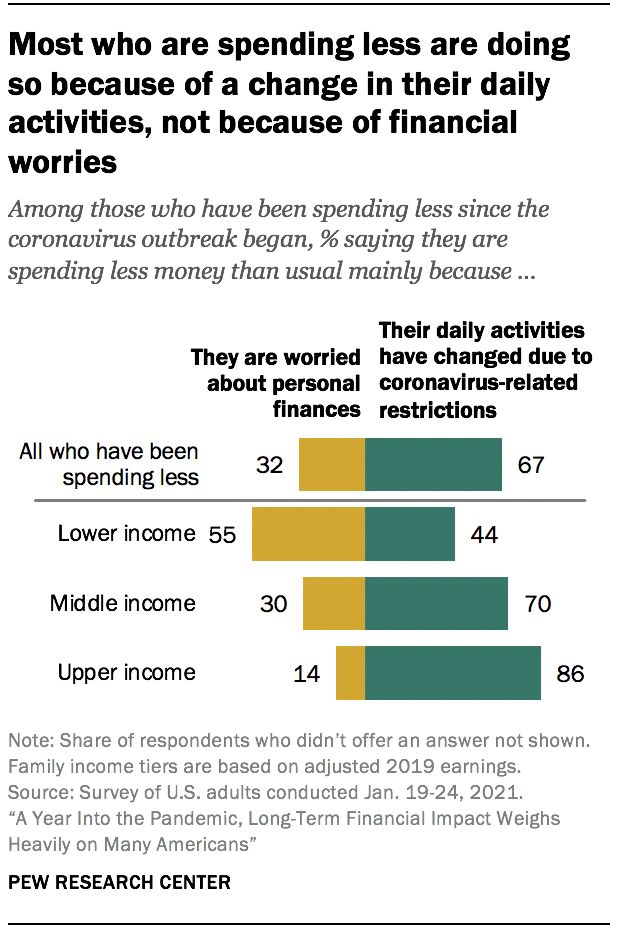
About four-in-ten Americans (42%) say they have been spending less money than usual since the pandemic began, and that is especially the case among upper-income adults. Some 53% of Americans with upper incomes say they’ve been spending less money, compared with 43% of those with middle incomes and 34% of those with lower incomes. Among those who say they have been spending less money, majorities with upper and middle incomes say this is mainly because their daily activities have changed due to coronavirus-related restrictions (86% and 70%, respectively). Among those with lower incomes, more say they’re spending less because they are worried about personal finances (55%) than because their daily activities have changed (44%).
About half of workers who personally lost wages during the pandemic (49%) are still earning less money than before the coronavirus outbreak started. This is particularly the case among older workers: 58% of employed adults ages 50 and older who experienced a pay cut since the outbreak began say they’re earning less money than before, compared with 45% of those younger than 50. One-in-five in the younger group (vs. 6% of those 50 and older) say they are now earning more than they did before the pandemic began, while about a third in each group say they are earning about the same as before.
Personal financial ratings vary widely across racial, ethnic and socioeconomic groups
A narrow majority of U.S. adults (53%) now describe their personal financial situation as excellent or good, up from 47% in April 2020. The share saying their finances are in only fair or poor shape now stands at 46%, compared with 52% earlier in the pandemic.
About six-in-ten White (60%) and Asian adults (58%) currently say their personal financial situation is in excellent or good shape. In contrast, a majority of Black (66%) and Hispanic (59%) Americans say their finances are in only fair or poor shape.
Personal financial ratings also vary considerably by gender, educational attainment and income levels, as was the case early in the pandemic. A majority of men (58%) rate their personal financial situation as excellent or good; 49% of women do so. About seven-in-ten adults with at least a bachelor’s degree (72%) say their personal finances are in excellent or good shape, compared with 48% of those with some college and 41% of adults with a high school diploma or less education.
Income differences are particularly pronounced, with a gap of 60 percentage points between the shares of upper-income (86%) and lower-income (26%) adults who rate their financial situation as excellent or good. About six-in-ten adults with middle incomes (58%) say their finances are in excellent or good shape. Family incomes are based on 2019 earnings.
People who report having a disability (63%) are more likely than those who do not have a disability (42%) to describe their personal financial situation as only fair or poor. This difference remains after taking into account that disabled adults are more likely to have lower incomes than those who are not disabled (82% of lower-income adults with a disability vs. 69% of those who don’t have a disability offer negative assessments of their personal finances).
More Americans say their personal financial situation has improved in the last year than say it has gotten worse
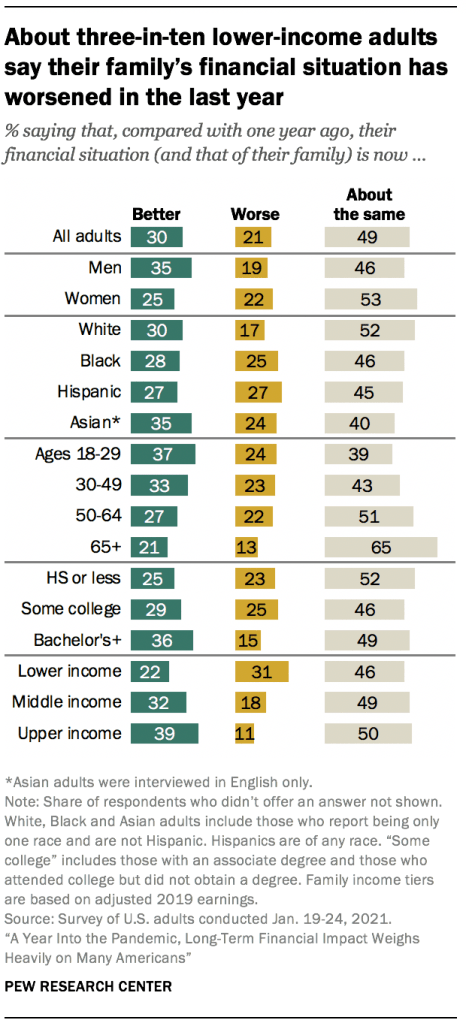
Despite the economic downturn caused by the coronavirus outbreak, about half of U.S. adults (49%) say their family’s financial situation is about the same as it was a year ago; three-in-ten say it has improved, and 21% say it is now worse than it was a year ago.
Upper-income adults are more likely than other income groups to have seen an improvement in their finances: 39% say their family’s financial situation is now better, compared with 32% of those with middle incomes and an even smaller share of lower-income adults (22%). About three-in-ten adults with lower incomes (31%) say their family’s situation has worsened (vs. 18% of adults with middle incomes and 11% of those with upper incomes).
These assessments vary by educational attainment and other demographic characteristics. Some 36% of adults with a bachelor’s degree or more education say their family’s financial situation is now better than it was a year ago; 29% of those with some college and a quarter of those with a high school diploma or less education say the same.
About a third of men (35%) say their family’s financial situation has improved, while a smaller share of women (25%) say the same. In turn, women are more likely than men to say their family’s financial situation is about the same as it was last year (53% vs. 46%).
About a quarter of Black (25%), Hispanic (27%) and Asian (24%) adults say their family’s situation is worse now than it was a year ago; a smaller share of White adults (17%) say this. White adults are more likely than those from other groups to say their financial situation is largely unchanged. (Differences in the shares across racial and ethnic groups saying their financial situation is now better are not statistically significant.)
More than half of Americans who say their family’s financial situation is worse than it was a year ago (55%) expect their finances to recover within two years, with 12% saying they expect it will take less than a year for their financial situation to get back to where it was a year ago. About a quarter (26%) think it will take three to five years and 6% say it will be between six and ten years before their family’s financial situation is back to where it was a year ago. About one-in-ten adults who say their family’s financial situation has worsened (12%) say it will never get back to where it was. These answers vary little, if at all, across demographic groups.
A plurality of lower-income adults are saving less during the pandemic
Many Americans were already struggling to save money before the coronavirus outbreak hit. Some 29% of adults overall say they are not usually able to put any money in savings. This is far more common among lower-income adults, 47% of whom say they are usually not able to save (vs. 25% of middle-income adults and just 8% of upper-income adults). About four-in-ten Black adults (38%) say they are usually not able to save, compared with 31% of Hispanic, 27% of White and 19% of Asian adults.
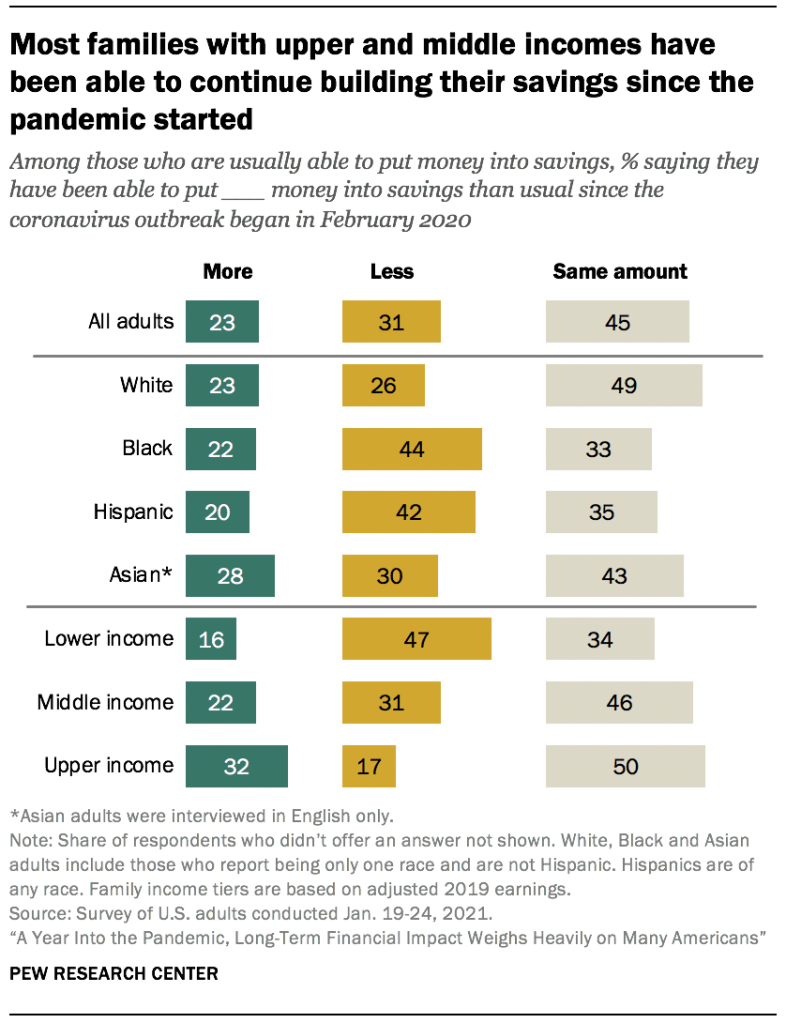
Among those who are typically able to put some money into savings, 45% say they are still saving about the same amount as they were before the pandemic, while 31% say they are saving less than usual and 23% say they are saving more.
Lower-income adults who usually put money into savings are far more likely than those in other income tiers to say they are now saving less than usual: 47% of lower-income adults say this, compared with 31% of those with middle incomes and 17% of those with upper incomes. By comparison, most middle-income and upper-income adults say they are saving about the same or even more than they were before the pandemic. Among those with middle incomes, 46% say they are saving the same and 22% are saving more than before. Even higher shares of those with upper incomes say this: half are saving about the same and 32% are saving more than before the pandemic.
Among those who are usually able to put money into savings, 44% of Black adults and 42% of Hispanics say they are saving less than they were before the pandemic, compared with 30% of Asian Americans and 26% of White adults. About half of White adults (49%) have continued putting the same amount into savings – higher than the share of Black (33%) and Hispanic (35%) adults who say the same.
Spending is down compared with before the pandemic for many Americans, but mostly because of a change in daily activities rather than concern about finances
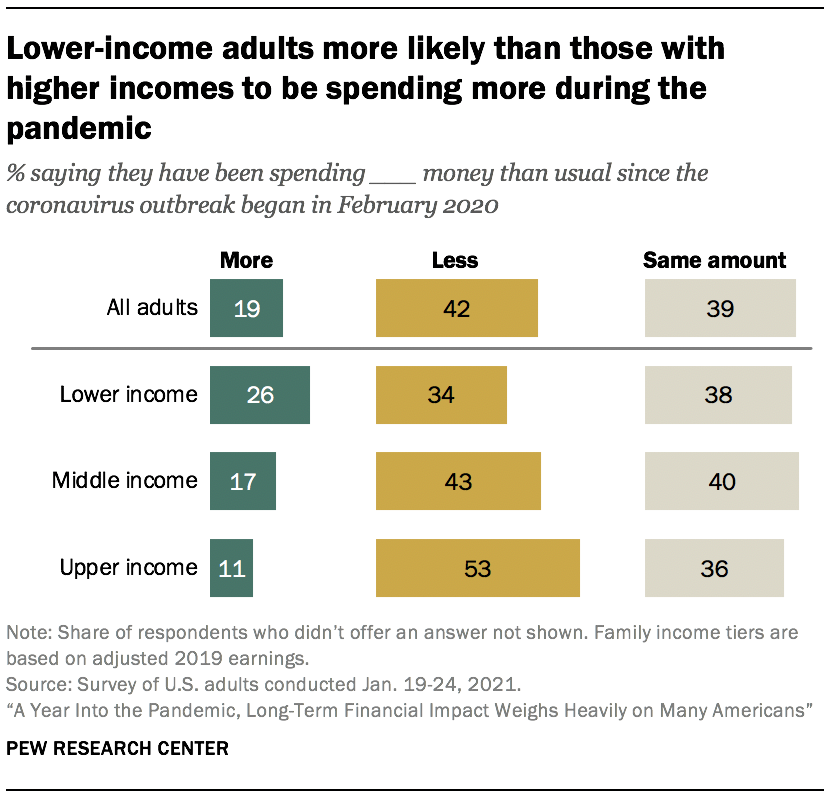
About four-in-ten Americans (42%) say they have been spending less money than usual since the coronavirus outbreak began, and a similar share (39%) say they have been spending about the same; 19% say their spending has increased.
Upper-income adults (53%) are more likely than those with middle (43%) or lower incomes (34%) to say they have been spending less money since the pandemic began. About a quarter of those with lower incomes (26%) say they have been spending more, compared with 17% of middle-income adults and 11% of upper-income adults.
Two-thirds of those who are spending less say this is due to their daily activities changing because of coronavirus-related restrictions rather than worries about their personal finances (32%).
This is overwhelmingly the case among upper-income adults who are spending less, 86% of whom say it’s because of their activities changing. Seven-in-ten middle-income adults in this situation say the same. But among lower-income adults who have reduced their spending, more say it’s because they are worried about their personal finances (55%) rather than their daily activities changing (44%).
A majority of lower-income adults who are not retired say the pandemic will make it harder for them to achieve their long-term financial goals
Aside from how long they think it will take them to get back to where they were a year ago, many Americans say the economic impact of the coronavirus will have long-term repercussions for their financial future. About half of U.S. adults who are not retired (51%) say that, in the long run, the economic impact of the coronavirus outbreak will make it at least somewhat harder for them to achieve their financial goals, with 16% saying it will make it a lot harder; 7% say the economic impact of the pandemic will make it a lot or somewhat easier for them to achieve their financial goals and 41% say it will be neither easier nor harder.
Lower-income adults are particularly likely to see the economic impact of the coronavirus outbreak as a potential impediment to reaching their long-term financial goals. About six-in-ten non-retired adults in this group (58%) say that, in the long run, the pandemic will make it harder for them to achieve these goals, including a quarter who say it will make it a lot harder. Half of those with middle incomes and 41% with upper incomes say the pandemic will make it harder for them to reach their financial goals in the long run.
Long-term assessments are especially grim among those who say their finances have taken a hit in the last year. Fully three-quarters of non-retired adults who say their financial situation is now worse than it was a year ago believe the economic impact of the coronavirus outbreak will make it harder for them to achieve their financial goals in the long run. That’s in contrast to 35% of those who say their financial situation is better compared with a year ago and 50% of those who say it is about the same.
Many older Americans whose employment was affected during the coronavirus outbreak say they have or may have to delay their retirement
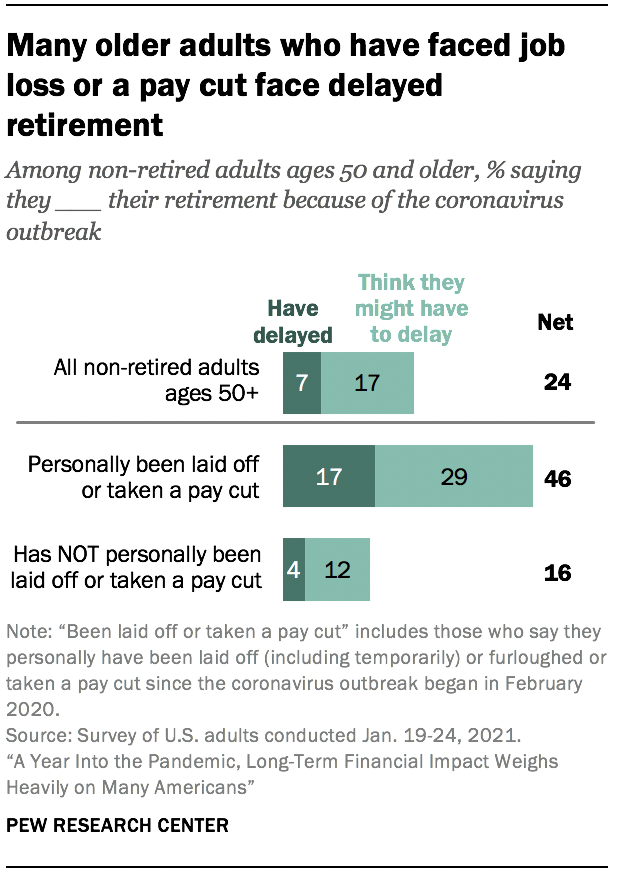
About a quarter of U.S. adults ages 50 and older who have not yet retired (24%) expect the coronavirus outbreak to affect their ability to retire. This includes 7% who say they have already delayed their retirement and an additional 17% think they might have to delay it.
Those who have personally been laid off or taken a pay cut since the pandemic began in February 2020 (27% of all adults 50 and older who are not retired) are much more likely to say they expect their retirement to be affected. More than four-in-ten (46%) say they either have already delayed or think they may have to delay their retirement because of the coronavirus outbreak, compared with just 16% who have not experienced a job loss or pay cut.
The shares of non-retired adults ages 50 and older who have delayed or expect to delay their retirement because of the coronavirus outbreak do not vary considerably across income levels or other demographic groups, including gender and educational attainment.
More than four-in-ten U.S. adults say they or someone in their household has lost a job or wages since the beginning of the coronavirus outbreak
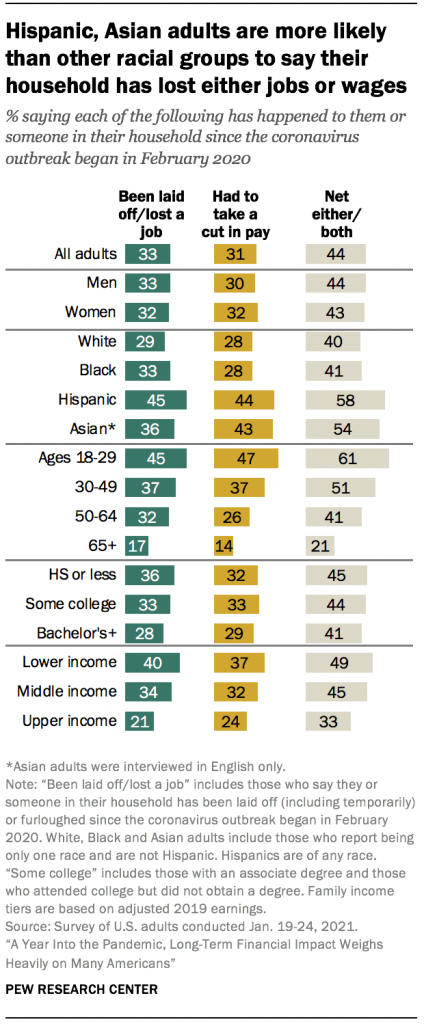
A third of U.S. adults say they or someone in their household has been laid off or lost a job (including being furloughed and temporarily laid off) since the coronavirus outbreak began in February 2020, and 31% say they or someone in their household has taken a cut in pay due to reduced hours or demand for their work during this period. Overall, 44% say their household has experienced at least one of these since the pandemic began.
Experiences with job and wage loss during the pandemic have not been felt equally across demographic groups. Hispanic (58%) and Asian (54%) adults are more likely than White (40%) or Black (41%) adults to say they or someone in their household has either lost a job or taken a pay cut or both since the outbreak began in February 2020. And while a majority of adults younger than 30 (61%) say they or someone in their household has had these experiences, about half of adults ages 30 to 49 (51%) and smaller shares of those ages 50 to 64 (41%) and 65 and older (21%) say the same.
About half of lower-income adults (49%) say their household has experienced job or wage loss since the coronavirus outbreak began in February 2020, as do 45% of middle-income adults. A far smaller – though substantial – share of upper-income adults (33%) say their household has had one or both of these experiences.
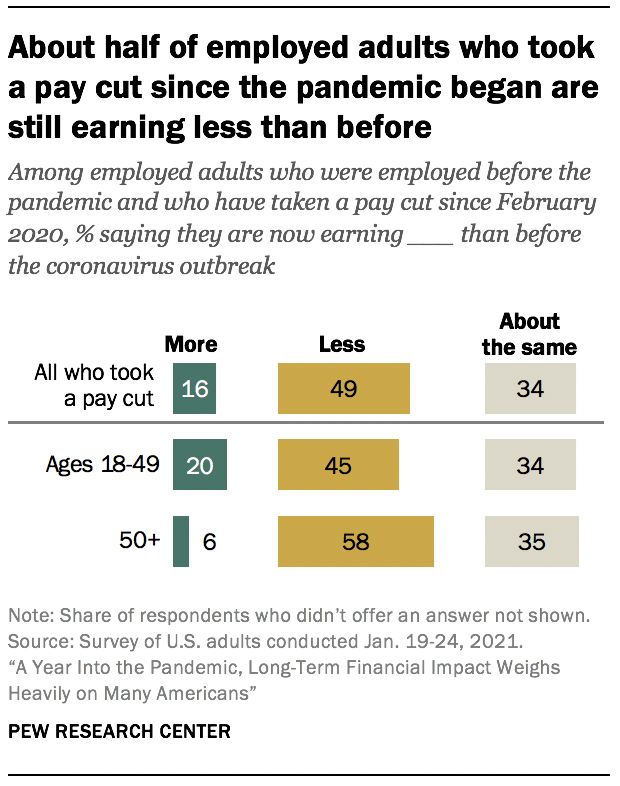
Many workers who lost wages during the pandemic are still earning less than they were before the coronavirus outbreak started. Among those who were working before the pandemic started and who personally experienced a pay cut since February 2020, about half (49%) say they are now earning less money than they did before the pandemic; 16% are now earning more money and 34% say they are earning about the same as before. This is consistent across most demographic groups, but employed adults ages 50 and older who experienced a pay cut since the outbreak began are more likely than those younger than 50 to say they’re earning less money than they did before (58% vs. 45%), while those in the younger group are more likely to say they’re earning more than they did before the pandemic (20% vs. 6%).
Lower-income workers are more likely than those with middle or upper incomes to have taken unpaid time off
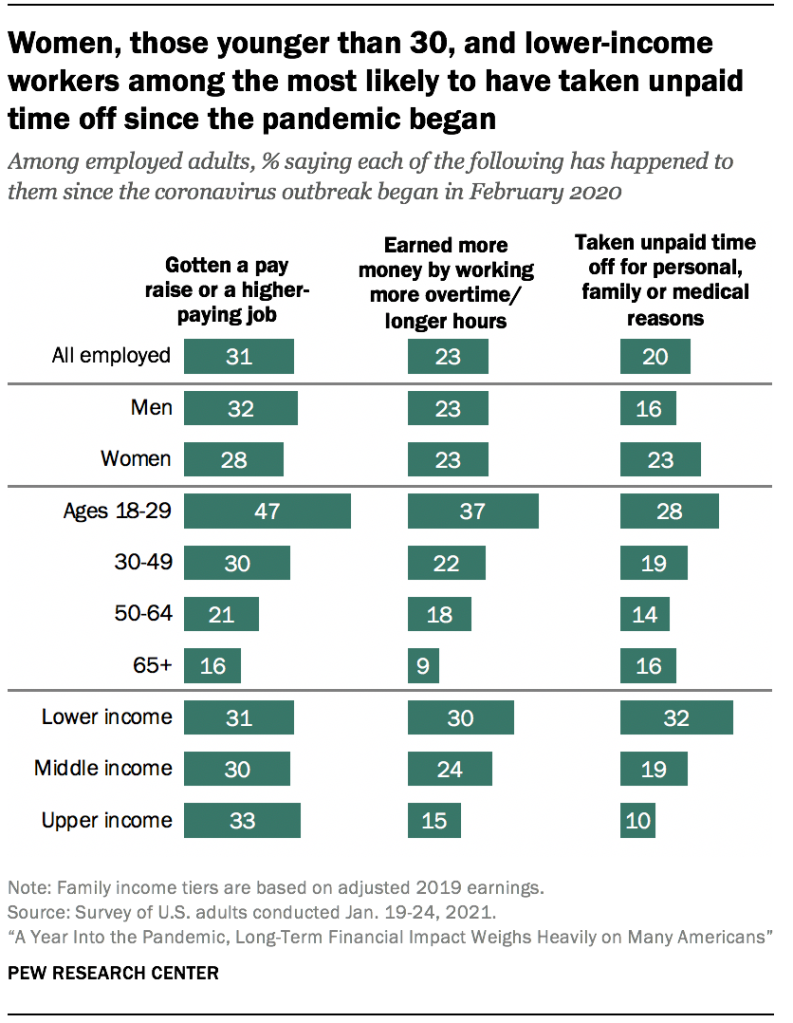
In addition to being more likely than those with higher incomes to have experienced job or wage loss since February 2020, lower-income adults are also more likely to have taken unpaid time off from work for personal, family or medical reasons during this time. About a third of lower-income workers (32%) say they’ve had to do this during this period, compared with 19% of middle-income workers and 10% of those with upper incomes. According to previous research, workers on the lower ends of the wage distribution are less likely than those at the upper ends to have access to paid sick leave.
Three-in-ten lower-income workers say they have earned more money by working more overtime or longer hours since the coronavirus outbreak began; 24% of middle-income workers and 15% of those with upper incomes say this has happened. And about three-in-ten workers across income tiers say they have gotten a pay raise or a higher-paying job during this time.
Workers younger than 30 are far more likely than older workers to say they have gotten a pay raise or a higher-paying job since the coronavirus outbreak began (47% vs. 30% of workers ages 30 to 49, 21% of those ages 50 to 64 and 16% of those ages 65 and older). Younger workers are also more likely than older adults to say they have earned more money by working more overtime or longer hours and to say they have taken unpaid time off work for personal, family or medical reasons.
The survey also finds that, among employed adults, men are somewhat more likely than women to say they have gotten a pay raise or a higher-paying job since the beginning of the coronavirus outbreak (32% vs. 28%). In turn, a larger share of employed women than men say they have taken unpaid time off work for personal, family or medical reasons since the beginning of the pandemic (23% vs. 16%).
About three-in-ten Americans often worry about their debt and saving for retirement, but these concerns were higher in April
Roughly three-in-ten adults say they worry every day or almost every day about the amount of debt they have (30%) and being able to save enough for their retirement (29%). About a quarter worry about paying their bills and the cost of health care for them and their family (27% each). About one-in-five often worry about paying their rent or mortgage (19%) or being able to buy enough food for them and their family (18%). Some 16% of workers say they frequently worry that they will lose their job or take a pay cut due to reduced hours or demand for their work. About four-in-ten or more adults say they worry about each of these at least sometimes.
These concerns were more pressing earlier in the coronavirus outbreak than they are now. Higher shares in April 2020 said that they frequently worried about saving enough for retirement (38%), paying their bills (38%) or debt (36%), the cost of health care for them and their family (35%), taking a pay cut (29% of employed adults) and losing their job (23% of employed adults). (The items on paying rent or a mortgage and being able to buy enough food were not asked in April.) The decrease in concern since April was evident across income levels.
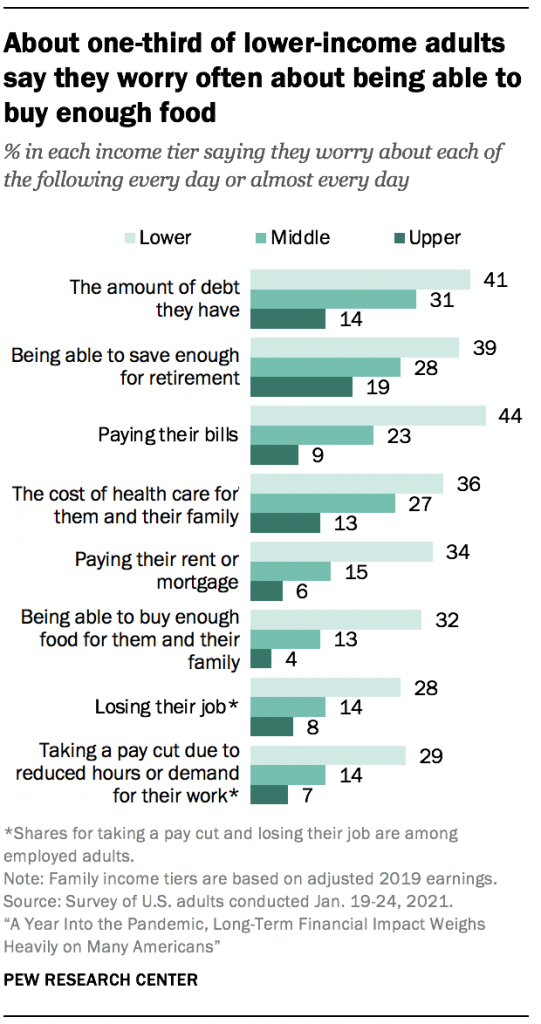
Lower-income adults are far more likely to worry often about each of these than middle- and upper-income adults. For example, 44% of those with lower incomes say they worry about paying their bills daily or almost daily, compared with 23% of middle-income adults and only 9% of those with upper incomes. And while about a third of lower-income adults say they worry about paying their rent or mortgage (34%) or being able to buy enough food (32%) daily or almost daily, 15% or less among middle-income and upper-income adults express similar concerns.
Adults living in households that have experienced job loss or a pay cut during the pandemic are more likely than those in households that have not to say they often worry about each of these concerns. For example, those who had their household’s job or pay affected are about twice as likely to say they worry daily or almost daily about being able to buy enough food for them and their families as those who were not affected (25% vs. 12%).
Black and Hispanic Americans (who have lower incomes on average than White Americans) are more likely than White adults to frequently have these worries. Meanwhile, Asian Americans are about equally as likely as White adults to say they often worry about their debt, saving for their retirement, the cost of health care, paying their bills and losing their job. However, they are more likely than White adults to say they worry about paying their rent or mortgage, being able to buy enough food and taking a cut in pay.
Adults 65 and older tend to be less worried about each of these concerns than their younger counterparts. In fact, the burden of some of these worries falls most heavily on those in the 30- to 49-year-old age group. For example, 25% of this group says they worry frequently about paying their rent or mortgage, compared with 20% of those ages 18 to 29, 19% of those 50 to 64 and 8% of those 65 and older.
Americans with disabilities – that is, those who say a disability or handicap keeps them from fully participating in work, school, housework or other activities – are also more likely than those without disabilities to say they often worry about each concern. For example, 36% of disabled Americans (who tend to have lower incomes than those without disabilities) say they often worry about the cost of health care for them and their family, while 25% of those without disabilities say the same.
About half of lower-income adults in households that have lost income during the pandemic have taken on debt to help make ends meet
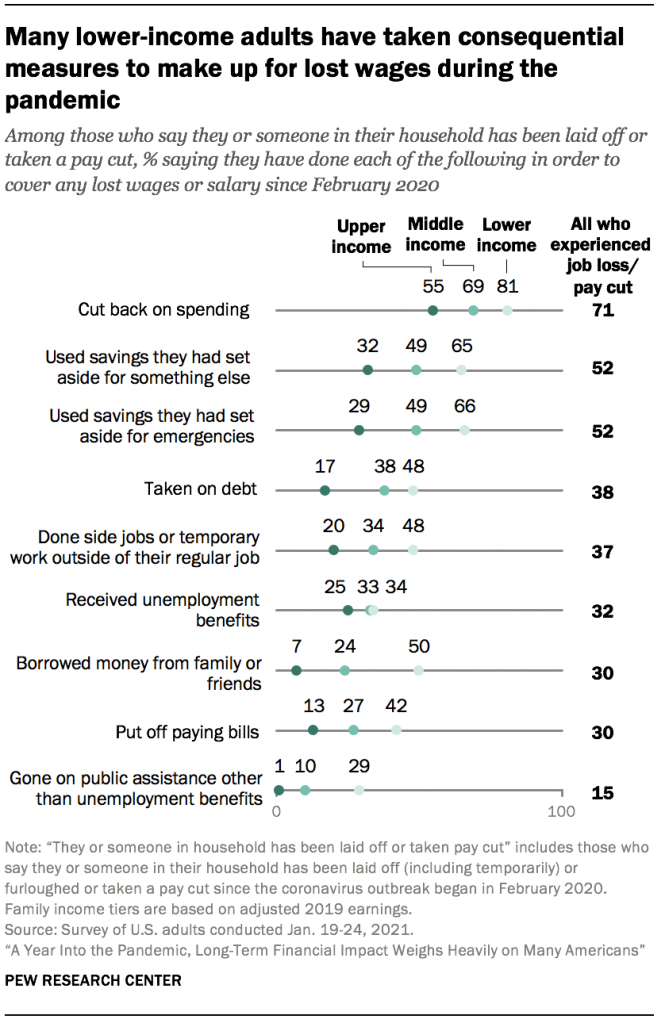
The survey also asked those who are in a household in which someone has been laid off or taken a pay cut since the pandemic began how they covered those lost wages or salaries. Cutting back on spending topped the list, with 71% saying they did this to help make up for their lost wages. Using savings was another common strategy, with about half of those who experienced a loss of wages saying they did this (52% say they used savings they had set aside for something else, and the same share say they used emergency savings). Smaller shares said they took on debt (38%), did side jobs or temporary work outside of their regular job (37%), received unemployment benefits (32%), borrowed money from family or friends (30%), put off paying bills (30%) or went on public assistance other than unemployment benefits (15%).
Lower-income adults whose households have experienced job or wage loss since the pandemic began are more likely than upper-income adults to say they have taken each of these steps. In fact, many in this group have taken consequential measures, such as borrowing money from family or friends (50%), taking on debt (48%) and putting off paying bills (42%).
Among upper-income adults whose household experienced a loss of income, 55% say they cut back on spending as a way to compensate. Much smaller shares (about a third or less) say they have taken each of the other measures asked about in the survey. Few said they have had to take the types of consequential measures that many lower-income adults rely on, such as taking on debt (17% of upper-income adults), putting off paying bills (13%) or borrowing from friends or family (7%).
Among households experiencing loss of income, reports of using unemployment benefits are more common among those who say they or someone in their household lost a job (permanently or temporarily).3 Overall, 39% of those who lost a job or had someone in their household who did say they received unemployment benefits, compared with 11% of those in households that experienced a pay cut but no job loss (even while many people who had their hours cut during the pandemic are eligible). Lower-, middle- and upper-income adults who experienced job loss are about equally likely to say they received this type of benefit.
About two-in-ten of those from households that experienced a job loss (19%) say they went on public assistance other than unemployment benefits, compared with 5% of those who experienced a pay cut but no job loss. Among the households who experienced job loss, 33% of lower-income adults say they went on this kind of public assistance, compared with 13% of middle-income adults and just 2% of upper-income adults.
Most lower-income adults who expect a stimulus payment say they will use it to pay for bills or essentials
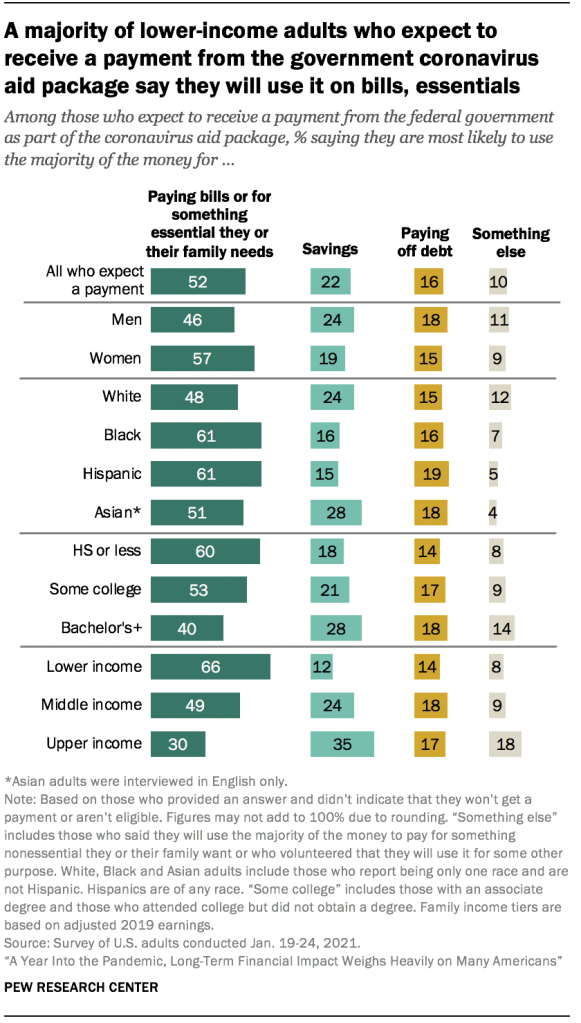
As the economic effects of the coronavirus pandemic continued in late 2020, Congress passed a second stimulus bill to help ease the financial hardships many Americans have faced. About half of U.S. adults who have received or expect to receive a payment from the federal government as part of the stimulus package (52%) say they will use a majority of these funds to pay bills or for something essential they or their family needs. Another 22% say they will save it; 16% say they will use it to pay off debt; and 10% say they will use it for something else, including for something non-essential they or their family wants, charitable donations, helping friends and family, supporting local businesses, or some combination.
The way Americans are planning to use payments from the second coronavirus aid package parallel what those who received or expected to receive a payment early in the pandemic said about how they planned to use those funds.
Lower-income adults are the most likely to say they will use a majority of the money to pay for bills or for something essential among those expecting a payment in each income group; 66% say this, compared with 49% of middle-income adults and 30% of those with upper incomes. About a third of adults with upper incomes (35%) say they expect to save most of it; 24% of those with middle incomes and 12% of lower-income adults say the same.
Plans for the stimulus payments vary across racial and ethnic groups and educational attainment. About six-in-ten Black and Hispanic adults (61% each) say they will use a majority of the money to pay for bills or essentials, compared with 48% of White adults and 51% of Asian adults. White and Asian adults are more likely than Black and Hispanic adults to say they will save it (24% and 28% vs. 16% and 15% respectively). Six-in-ten adults with a high school diploma or less education say they will use a majority of the money to pay for bills or essentials; 53% of those with some college, and 40% with a bachelor’s degree or more education say the same.
About four-in-ten Americans say the federal government’s aid package will help them and their household at least a fair amount
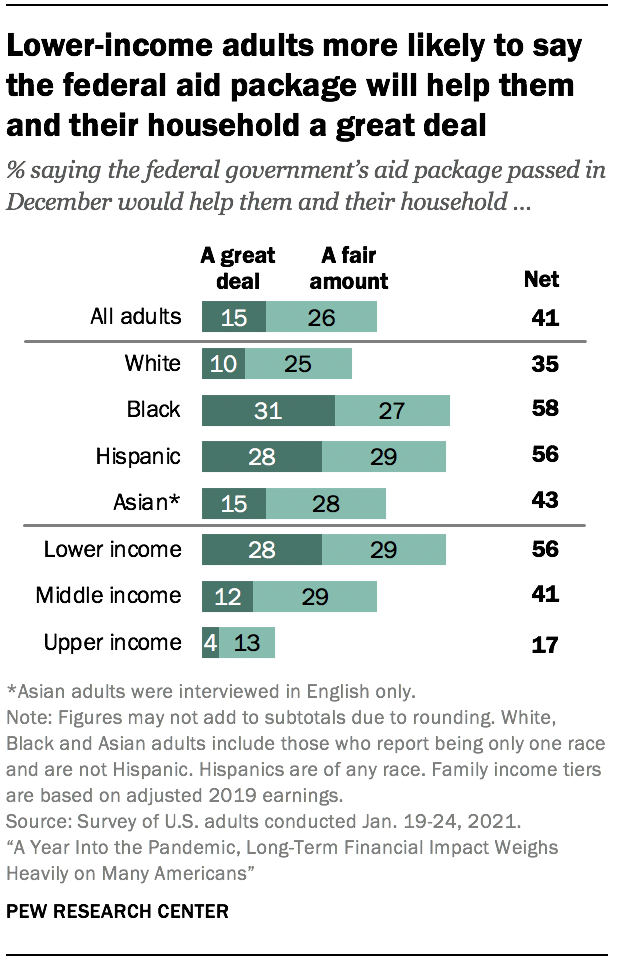
Overall, about four-in-ten adults (41%) say the aid package passed by the federal government in December 2020 would help them and their household a great deal or a fair amount. Majorities say the aid package will help small businesses (54%), large businesses (57%), and unemployed people (61%) at least a fair amount. This is a notable shift in confidence from early in the pandemic when about seven-in-ten or more Americans said the aid package passed in March would help large and small businesses and unemployed people; 46% said the earlier aid package would help them and their household.
A majority of adults with lower incomes (56%) say the aid package will help them and their household at least a fair amount, with 28% saying it would help them a great deal. This compares to 41% of middle-income adults and 17% of those with upper incomes who say it will help them at least a fair amount.
Among other key demographic groups, adults under age 30, Black and Hispanic adults, and those without a college degree are among the most likely to say the aid package will help them and their household at least a fair amount. Over half of Black and Hispanic adults say the aid package will help them and their households (58% and 56% respectively) at least a fair amount, with significant shares saying it will help them a great deal (31% and 28% respectively). Smaller shares of White (35%) and Asian adults (43%) say it will help them a great deal or a fair amount.
Half of adults under age 30 say the federal aid package will help them and their households at least a fair amount; 43% of those ages 30 to 49, 39% of those ages 50 to 64, and 33% of adults ages 65 and older say the same. Adults with a high school diploma or less education are more likely to say the federal aid package will help them and their households at least a fair amount (50%) than those with some college experience (42%) and those with a bachelor’s degree or more education (31%).
No clear consensus on who should have the greatest responsibility for making sure people can meet their basic economic needs during the coronavirus outbreak
When asked who should have the greatest responsibility for making sure people can meet their basic economic needs during the coronavirus outbreak, 45% point to the federal government, while a third say people themselves or their families should have the greatest responsibility. Smaller shares say state or local governments (12%), charitable organizations (2%), or another source (6%), most often a combination of all of these, should be most responsible.
There is a sharp partisan divide on this issue. About six-in-ten Democrats and those who lean toward the Democratic party (61%) say the federal government should have the greatest responsibility, and just 18% say it should be people themselves or their families. Among Republicans and Republican leaners, 28% point to the federal government, while a larger share (51%) say people themselves or their families should have the greatest responsibility for making sure they can meet their basic economic needs during the pandemic.
Liberal Democrats are the most likely to point to the federal government as having the greatest responsibility to ensure people can meet their basic economic needs during the coronavirus outbreak. About seven-in-ten liberal Democrats (72%) say this, compared with 52% of conservative or moderate Democrats, 36% of moderate or liberal Republicans, and an even smaller share of conservative Republicans (23%). In turn, conservative Republicans are the most likely to say it is people themselves or their families who have this responsibility; 57% say this compared with 41% of moderate or liberal Republicans, 25% of moderate or conservative Democrats and just 11% of liberal Democrats.
