
(Related post: How focus groups informed our study about nationalism and international engagement in the U.S. and UK)
Pew Research Center often collects data through nationally representative surveys, and we use focus groups to supplement those findings in interesting ways and inform the questionnaire design process for future work.
When conducting focus groups, we typically use qualitative methods to understand what our participants are thinking. For example, we tend to hand-code key themes that come up in discussions. But in our latest focus group project, we wondered if we could use quantitative methods, such as topic models, to save time while still gaining valuable insights about questionnaire development.
Some of these methods worked well, others less so. But all of them helped us understand how to approach text-based data in innovative ways. In general, we found that quantitative analysis of focus group transcripts can generate quick, text-based summary findings and help with questionnaire development. But it proved less useful for mimicking traditional focus group analysis and reporting, at least with the specific quantitative techniques we tried.
Background
In the fall of 2019, the Center held focus groups in the United States and United Kingdom to talk with people about their attitudes toward globalization. These discussions focused on three different contexts: participants’ local community, their nation of residence (U.S. or UK) and the international community.
After conducting 26 focus groups across the two nations, we transcribed the discussions into separate files for each group. For our quantitative analysis, we combined all of the files into one .csv document where each participant’s responses — whether one word or a short paragraph — corresponded to one row of the spreadsheet. To prepare the text for analysis, we tokenized the data, or split each line into individual words, and further cleaned it by removing punctuation and applying other preprocessing techniques often used in natural language processing.
Preliminary quantitative findings
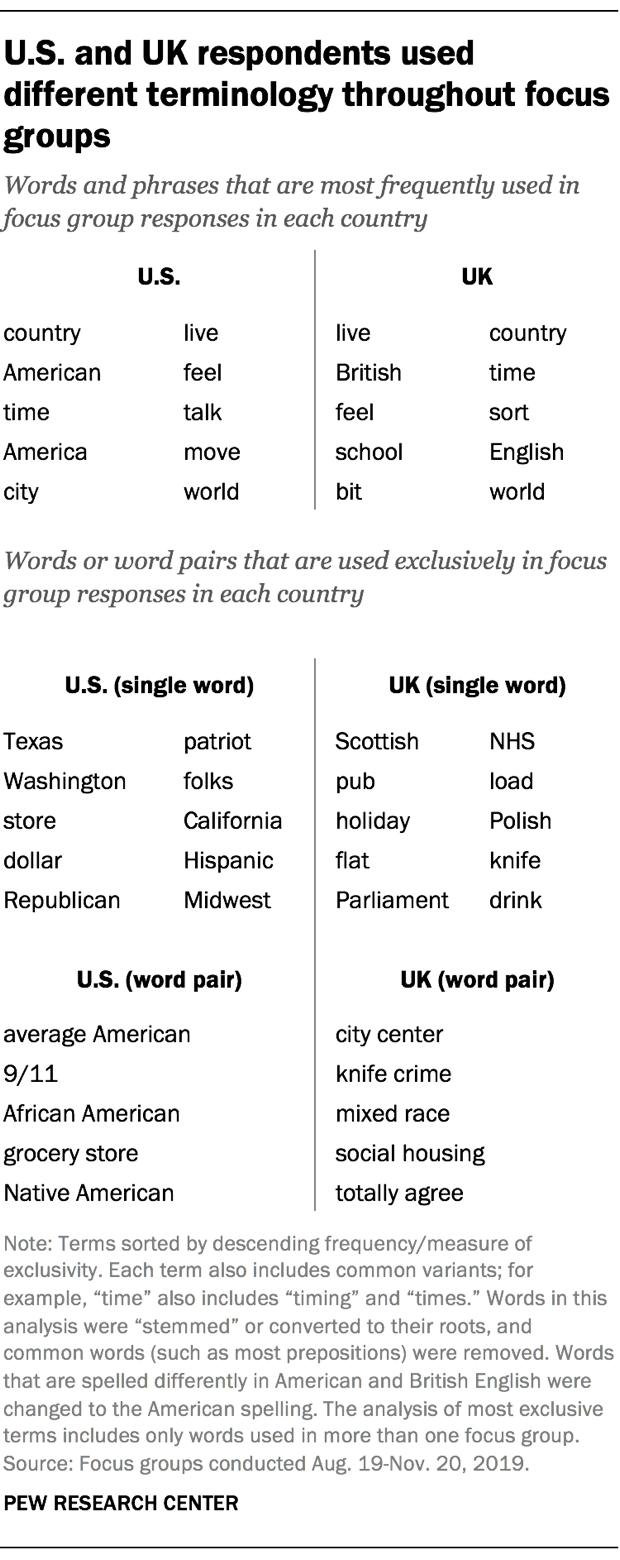
As a first step, we conducted a basic exploration of focus group respondents’ vocabulary. Several words frequently emerged among participants in both the U.S. and UK, including “country,” “live” and “feel,” all of which appeared in at least 250 responses across groups in each country. (This analysis excludes pronouns, articles and prepositions that are common in all spoken English, such as “he,” “she,” “they,” “a,” “the,” “of,” “to,” “from,” etc. Names of cities where focus groups took place and text from group moderators are also excluded from analysis.)
We also found that several words and phrases distinguished the U.S. focus groups from those in the UK. Terms like “dollar” and “Republican” were among the most common terms only used by the American groups, while the UK’s national health system (“NHS”) and legislative body (“parliament”) appeared frequently in the British groups but were never used by Americans.
As an exploratory tool, this kind of analysis can point to linguistic distinctions that stray from the predetermined topics included in a focus group guide. For instance, while we asked the groups in oblique ways about what it takes to be American or British, respectively, we never explicitly asked about immigration or minority groups in their country. Nonetheless, “African Americans” and “Native Americans” exclusively arose in the U.S. groups, while “Polish” and “mixed race” people were discussed in the UK. This told us that it might be worthwhile for future survey questionnaires to explore topics related to race and ethnicity. At the same time, it’s possible that our focus groups may have framed the conversation in a unique way, based on the participants’ racial, ethnic or immigration background.
Word correlations
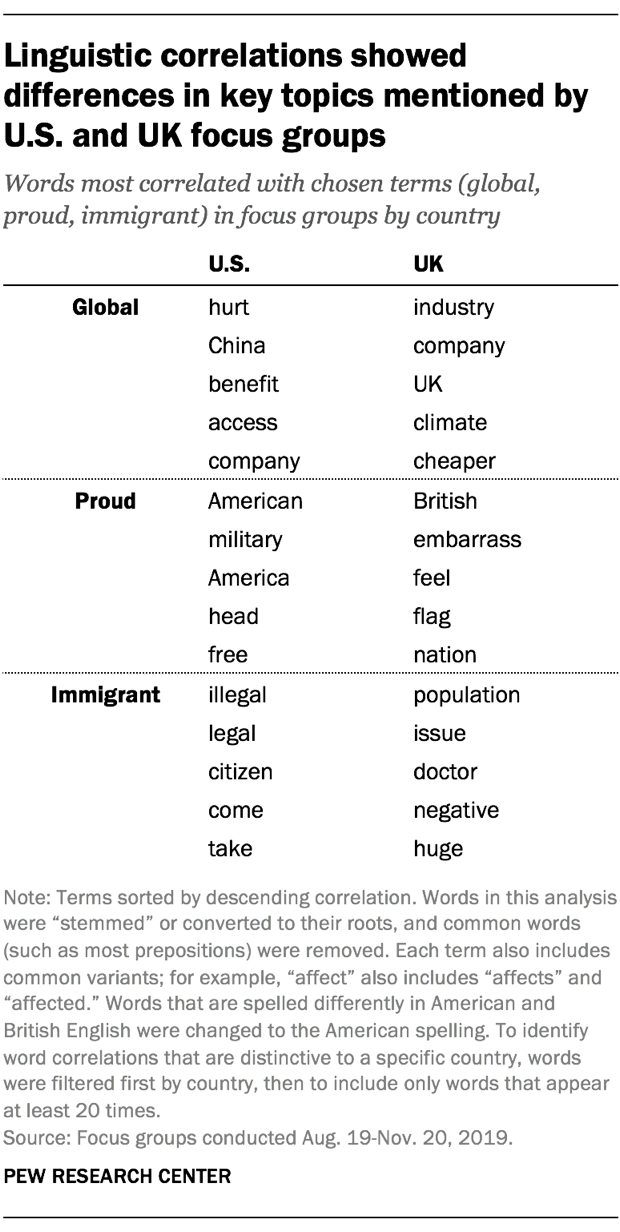
We used another computational tool, pairwise correlation, for some exploratory text analysis that measures how often words co-occur compared with how often they are used separately. Using three terms related to key themes that the focus groups were designed to study — “global,” “proud” and “immigrant” — we can get a sense of how focus group participants talked about these themes simply by identifying other words that were positively correlated with these topical terms. By further filtering these other terms to those that were mainly used in just one country, we can capture unique aspects of American and British views on global issues, national pride and immigration.
Both British and American participants discussed their nationalities when the conversation turned to pride. For instance, the words that most commonly appeared alongside “proud” in each country were “British” and “American,” respectively. (We considered the words “America” and “American” as separate terms, rather than variants of the same term.) Though “proud” among Britons often involved discussion of the word “flag,” “proud” in the U.S. correlated with “military.” Of course, correlation alone does not reflect whether these discussions had positive, negative or neutral connotations.
Discussions about migration and global issues — including “globalization,” which we shortened to “global” in our text processing — also varied across the two countries. When U.S. respondents used the word “immigrant,” they were also likely to use words like “illegal,” “legal,” “come” and “take.” By comparison, Britons who used the term were liable to do so alongside terms like “doctor” or “population.”
British participants used the word “global” alongside terms related to business (“company,” “industry,” “cheaper”) and global warming (“climate”). In the U.S., on the other hand, the discussion about globalization and immigration often accompanied terms like “hurt,” “China,” “benefit” and “take.”
Pew Research Center has conducted several surveys on the topics of migration, climate change and views of China, among others. Our focus groups confirmed that these issues play a part in how individuals see their country’s place in the world, though they also highlight that, in different nations, people approach these topics in distinct ways that may not be immediately evident in traditional survey questions.
Topic models
In recent years, the Center has explored the use of topic models for text-based data analysis. This method finds groups of words that appear alongside one another in a large number of documents (here, focus group responses), and in the process finds topics or themes that appear across multiple documents. In our attempt to quantitatively analyze this set of focus group transcripts, we had somewhat limited success with this approach.
On first pass, we used a probabilistic topic model called latent Dirichlet allocation, or LDA. But LDA often created topics that lacked coherence or split the same concept among multiple topics.
Next we turned to structural topic models (STM), a method that groups words from documents into topics but also incorporates metadata about documents into its classification process. Here, we included a country variable as one such “structural” variable. STM allowed us to set the number of topics in advance but otherwise created the topics without our input. (Models like these are often called “unsupervised machine learning.”) We ran several iterations of the model with varying numbers of potential topics before settling on the final number.
(For more on the Center’s use of topic modeling, see: Making sense of topic models)
Our research team started at 15 topics and then increased the number in increments of five, up to 50 topics. With fewer than 35 topics, many word groupings seemed to encompass more than one topic. With more than 35 topics, several topics that appeared distinct began to split apart across topics. There was no magic number, and researchers with the same data could reasonably come to different conclusions. Ultimately, we settled on a model with 35 topics.
Some of these topics clearly coalesced around a certain concept. For instance, we decided to call Topic 11 “Brexit” because its most common terms included “vote,” “leave,” “Brexit,” “party” and “referendum.” But while this topic and others appeared quite clear conceptually, that was not uniformly the case. For example, one topic looked as though it could relate to crime, but some terms in that topic (e.g., “eat” and “Christian”) did not fit that concept as neatly.
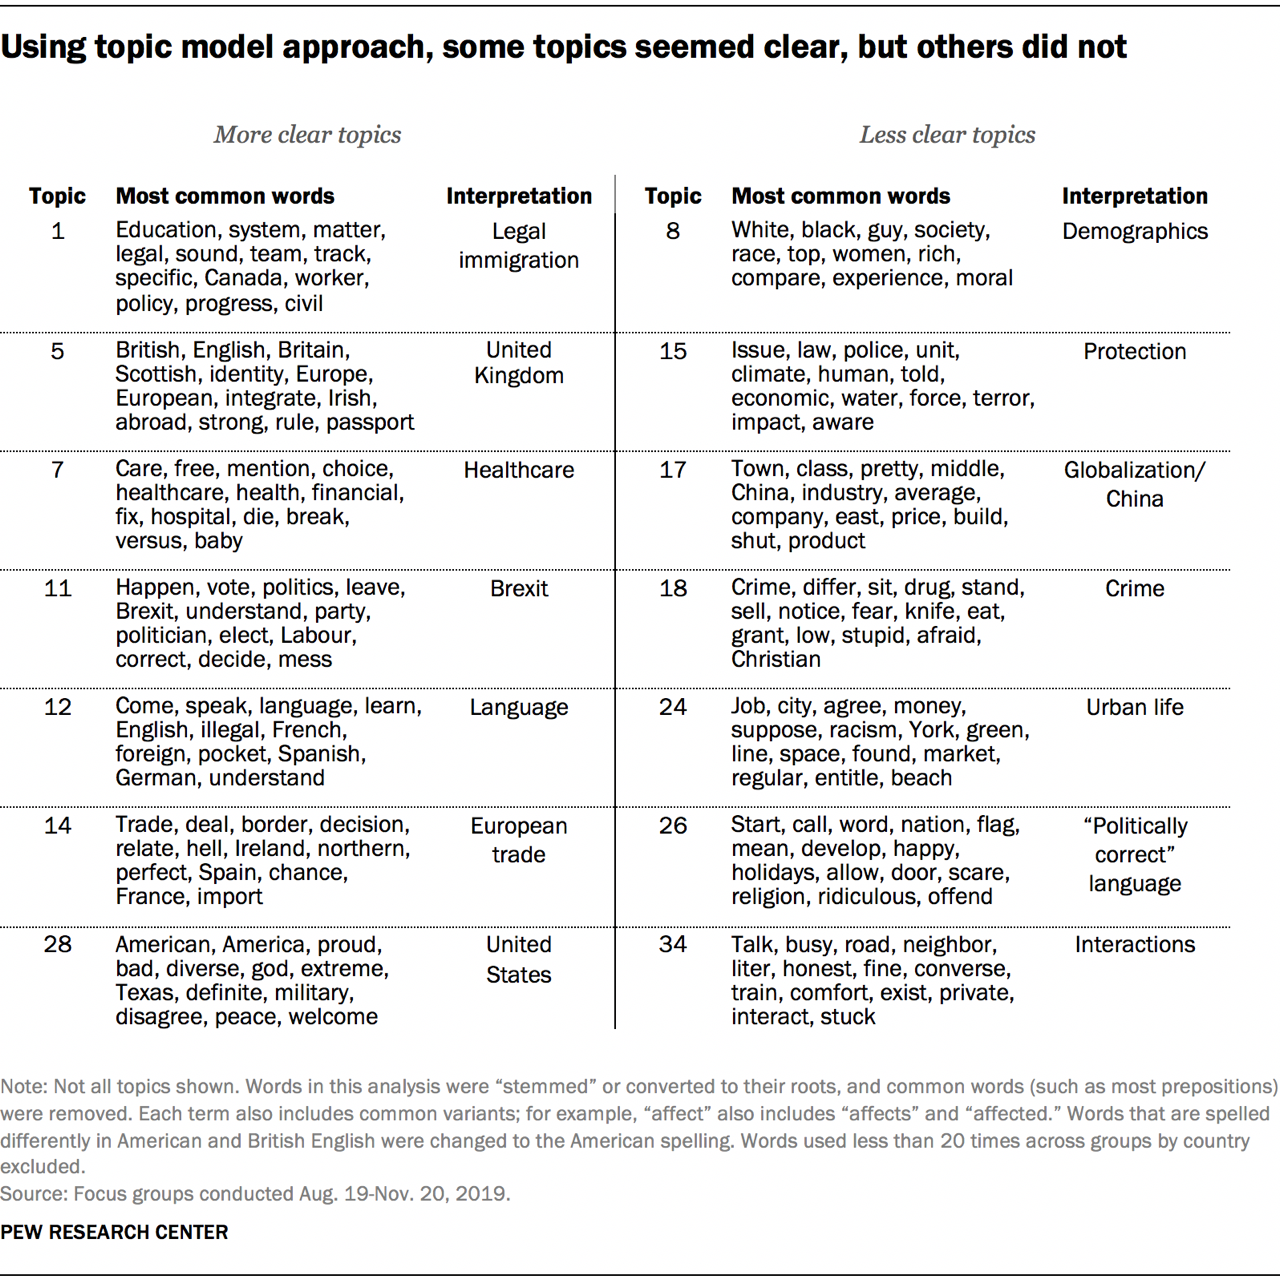
We named some of the topics based on the themes we saw — “Legal immigration,” for example, and “European trade.” But as other researchers have noted, that does not necessarily mean the word groupings are definitely about that theme. In this case, we used topic models as an exploratory analysis tool, and further research would be needed to validate each one with a higher degree of certainty and remove conceptually spurious words.
Another important consideration is that topic models sometimes group topics differently than researchers might be thinking about them. For that reason, topic models shouldn’t be used as a measurement instrument unless researchers take extra care to validate them and confirm their assumptions about what the models are measuring. In this project, the topic models simply served to inform questionnaire development for future multinational surveys. For example, Topic 12 in this experiment touches on issues of how spoken language relates to national identity, and future surveys may include a question that addresses this concept.
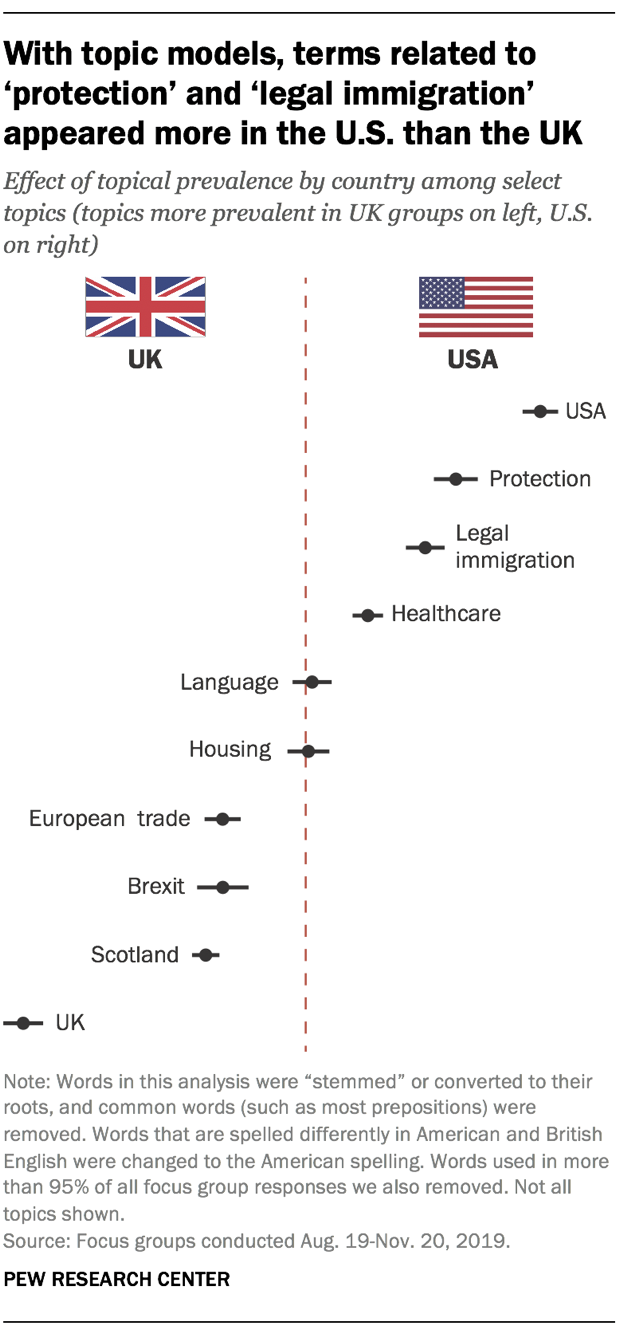
One helpful aspect of the topic model approach is that it allowed us to see which topics were more prevalent in the U.S. or UK, or if they appeared in both. American respondents, for example, more frequently discussed topics related to the U.S. and legal immigration, while British respondents more often discussed topics related to Brexit and trade in Europe. Topics that researchers coded as “language” and “housing” appeared with relatively the same prevalence in both countries.
However, characteristics of the data and problems with initially interpreting topics can cause further difficulties in this analysis. For instance, a topic we labeled “protection” was much more prevalent in American focus group discussions. That might have led us to assume that Americans are more concerned than their British counterparts with safety-related issues. But the focus groups we conducted were not nationally representative of the populations of either country, so we couldn’t draw this type of conclusion from the analysis. Additionally, because the topic itself might include words that have no relation to the concept of protection, researchers would likely need to consult the full transcripts that mention these topics — as well as external resources — before using this for questionnaire development.
Text-based classification
Qualitative coding of focus group transcripts is a resource-intensive process. Researchers who carried out the qualitative analysis of these transcripts considered using a Qualitative Data Analysis Software, or QDAS. These are tools designed for qualitative researchers to analyze all forms of qualitative data, including transcripts, manually assigning text into categories, linking themes and visualizing findings. Many disciplines employ these methods for successfully analyzing qualitative data.
We wondered if quantitative methods would let us achieve similar ends, so we explored ways to potentially streamline procedures with quantitative tools to minimize the time and labor needed to classify text into topics of interest. Unlike with topic models, a text-based classification model uses predetermined topics, or variables, for the algorithm to classify. (This falls into a broader category called “supervised machine learning.”) A successful classification algorithm would mean that we could avoid having to read every transcript to determine what content belonged to certain groups, or having to make the kind of subjective judgments that are necessary with qualitative software.
We used an extreme gradient boosting model (XGBoost) to classify focus group responses as relevant or not relevant to three different topics: immigration, the economy and the local community. We chose these topics because each emerged in the course of the focus group discussion — some as overt topics from prompts in the focus group guide (e.g., the local community), others as organic themes when people discussed their neighborhoods, national identity and issues of globalization (e.g., immigration and the economy).
Two of our researchers coded the same set of randomly selected focus group responses, about 6% of approximately 13,000 responses from all groups combined. They used a 1 to indicate the response was about a topic and 0 to show it was not. From the set of coded responses, each of the three topics appeared at least 70 times.
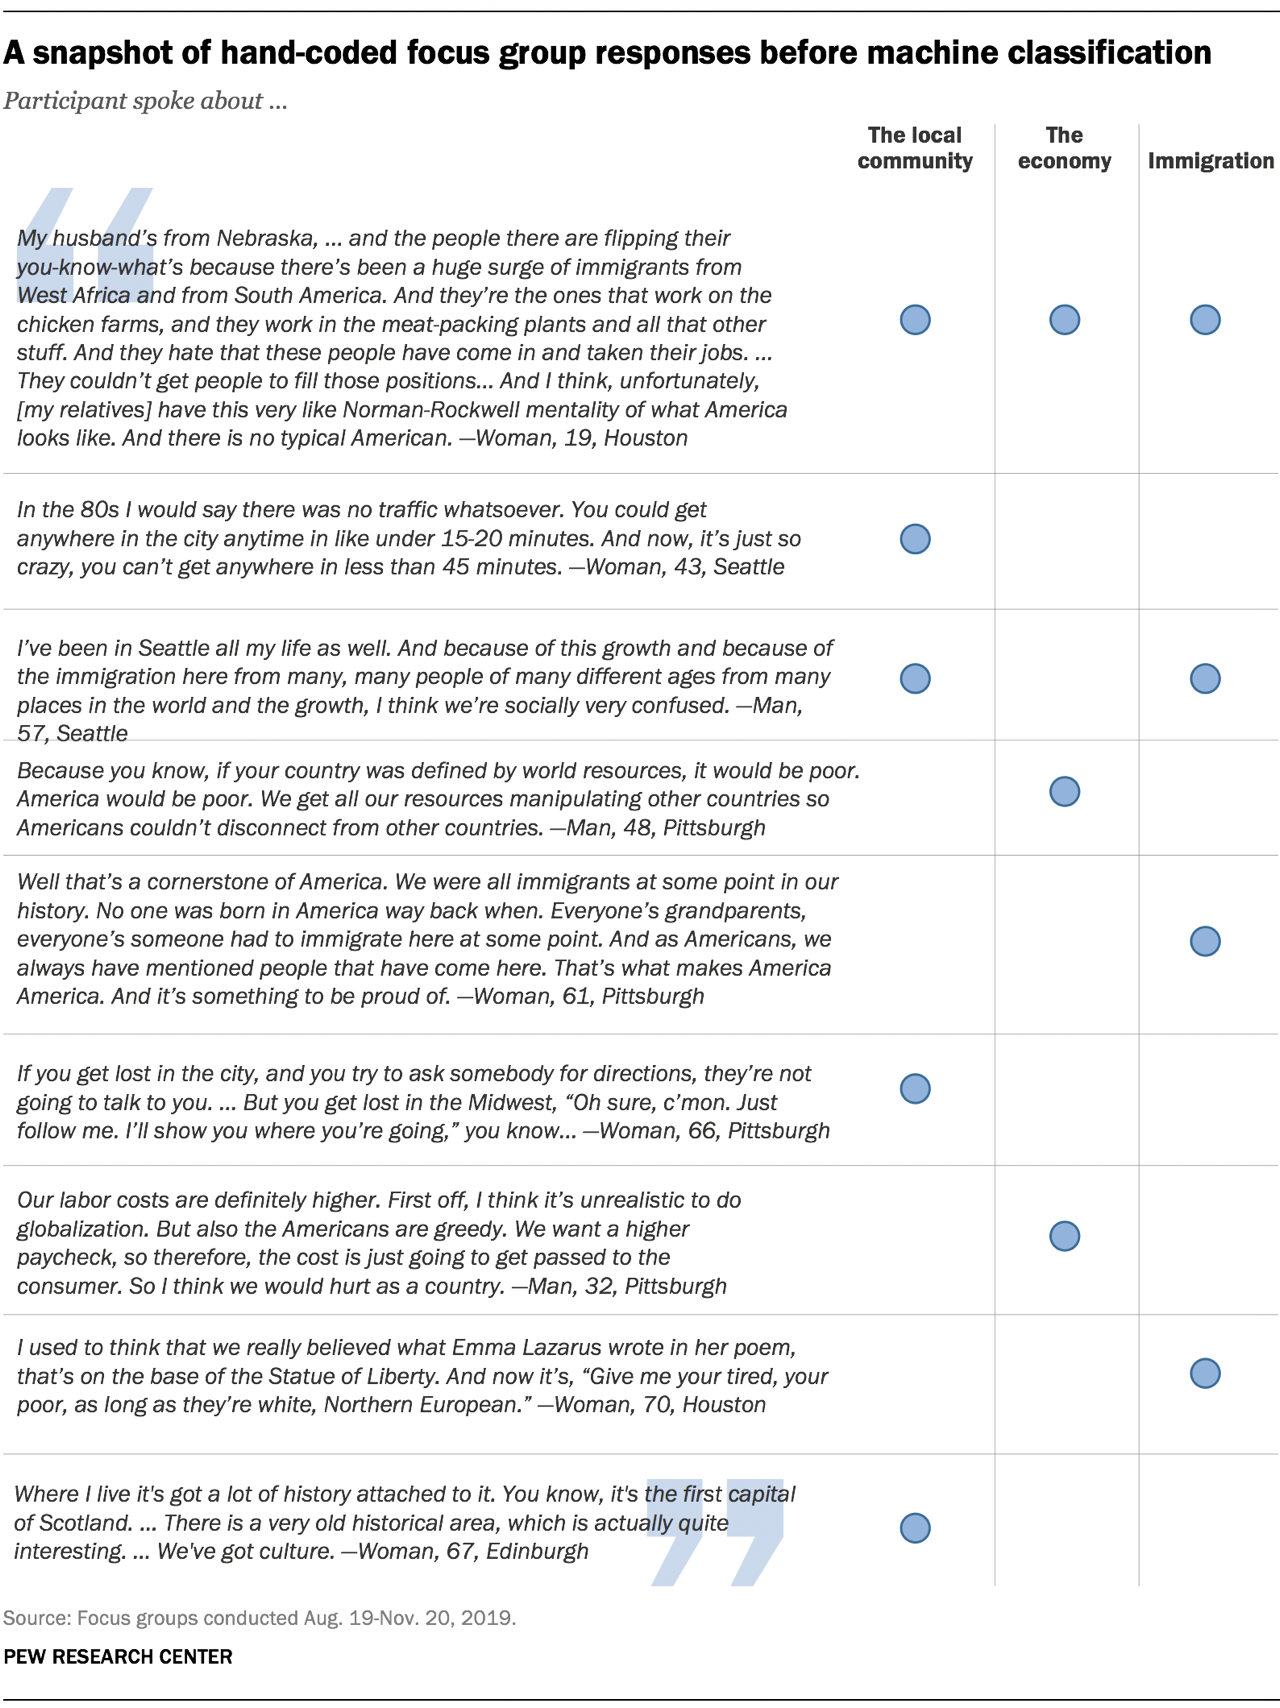
The model’s performance proved lackluster. When we compared the model to our hand coding, the accuracy rate ranged from 85% to 93%. But it also failed to identify the topic in most cases where it occurred, meaning that much of the accuracy was driven by matching on instances coded as 0 (i.e. the response is not about that topic) since 0 was much more prevalent across categories. One can liken this to a test for a rare disease. If only 1% of people in a population have a disease and the test returns only negative results to all people tested, the accuracy would be high — 99% of tests would be correct. But the test would have little utility since there would be no positive matches in instances where people were actually infected.
Using a measure similar to accuracy called the kappa, a statistic that examines agreement while adjusting for chance agreement, we found that the classifier performed poorly with a kappa of no more than .37 for two of our topics. In addition, we looked at the models’ precision and recall, metrics that help evaluate the effectiveness of a model. Precision ranged from 20% to 100%, while recall ranged from 4% to 27% among two of the topics. On the third topic — the local community — the model assigned zero to all cases.
Conclusion
The quantitative techniques that we explored in this post do not completely replace a traditional approach to qualitative research with focus group data. Using a quantitative approach, however, can aid in exploratory analysis and refining questionnaire development without having to attend every group in person or read through hundreds of pages of text. The tools we used are far from exhaustive, and as the Center continues to use focus groups as part of the research process, we are hopeful that we can learn more about how to employ innovative techniques in our analysis.
This post benefited from feedback provided by the following Pew Research Center staff: Dennis Quinn, Patrick van Kessel and Adam Hughes.


