
Pew Research Center is a fact tank — a nonpartisan research organization committed to creating a foundation of facts to help inform policymakers and the public about important issues, without taking policy or advocacy positions. To that end, all of the material we release, from reports to blog posts to interactive graphics and even tweets, goes through a rigorous verification process we call a “number check.”
It’s called a number check, but we check much more than the numbers. Apart from verifying that the numbers cited in our writing or associated charts are correct, we ask ourselves other questions, too: Are we describing the numbers in a way that’s accurate and fits with the narrative? Are the claims we make, such as calling something a “majority,” statistically significant? Are we leaving out any keys to understanding the data, such as a definition of the survey “universe”? Is our writing biased or misleading in any way? Will it be understood by our audience?
Although there are slight differences in the process depending on the nature of the data used in a given report (as well as the needs of the specific team within the Center that’s publishing it), the process is rigorous no matter what we’re checking. To illustrate how we go about it, here’s a step-by-step walkthrough of how I number check a piece of domestically focused survey research:
Getting to know the data
Ideally, a number check is done by someone who is somewhat familiar with the project or subject matter but who didn’t contribute to the writing or graphics at all. This reduces the chances that the number checker will make any of the same errors as the author and also allows for a fresh perspective.
First, I talk to the author or authors of the content to familiarize myself with the data source, discuss any concerns they may have about sensitive language or possible pitfalls with the data, and assess the number-checking needs for the underlying data. While our survey data goes through a rigorous quality control check before we start analyzing it — mainly to identify anomalies or programming errors — any custom tables or statistical programming syntax the author created will likely need to be number checked or replicated. This is to ensure variables are coded correctly and that the syntax is performing the intended statistical analyses. If the research is based on a secondary source, such as U.S. Census Bureau data, the number checker will need to verify that the correct file was downloaded and review or replicate the author’s analysis.
Checking every word and number
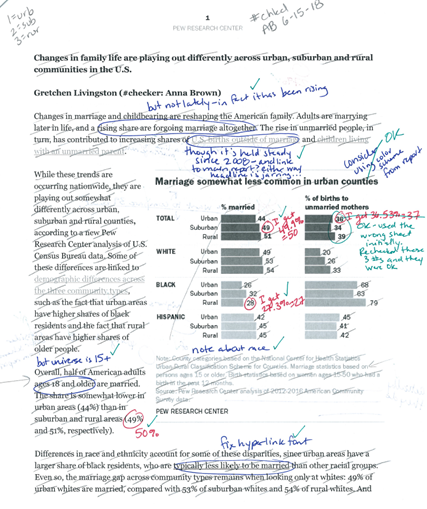
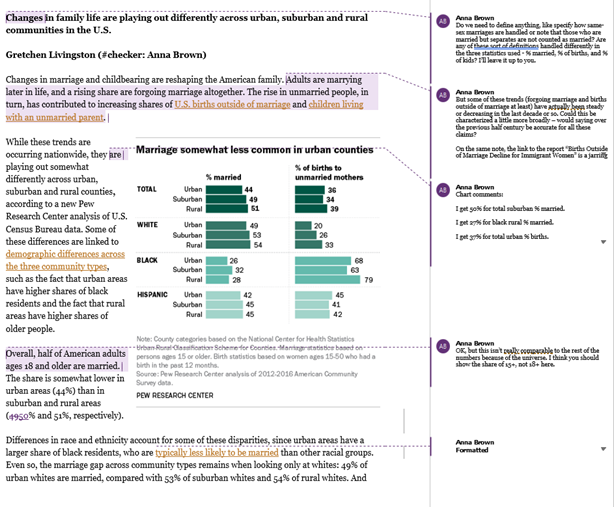
Once the underlying data sources are verified, I can dive into the actual text and graphics of the report or blog post. All number checkers have their own methods, but I always number check on paper, crossing off each word and number in pencil as I confirm it. Suggestions and style changes go in blue pen and wrong numbers are pointed out in red. At the end of the process, I do a double check to make sure all changes were put into the final version correctly and check off each note in green pen. Here’s an example of what a number-checked blog post can look like:
When number checking a report or blog post, I usually start by checking the charts and tables and asking myself the following questions:
· Is each number shown in the chart correct? Are numbers rounded correctly?
· Is the underlying number that was plotted in the chart correct? For example, does a point on a line chart labeled 50% actually represent 50% on the chart? Is a bar labeled 38% longer than one labeled 30%?
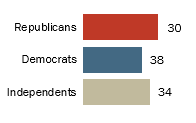
· Are all the subgroups in a given chart (e.g., Republicans, Democrats, independents) based on large enough sample sizes that we feel confident about our estimates? (Our usual rule of thumb is to require an effective sample size of about 100 or more.)
· Does the sub-headline accurately describe the universe the chart is based on? Are the sub-headline and chart labels clear in explaining what the chart conveys? If the chart is based on a survey question, do the chart labels and sub-headline wording capture the survey question?
· Are the notes and source in the chart accurate? Are any notes missing? For example, if the chart displays data by race and ethnicity, do we have a note to clarify that whites and blacks include only single-race non-Hispanics, while Hispanics are of any race?
· Is the headline accurate and relevant to the main finding of the chart?
· Can this chart stand alone? If it is shared out of context on social media, does it have all the critical information needed to understand it, or could it be misinterpreted?
Verifying claims and characterizations
Next, I begin to check the text of the report or blog post, including the methodology, terminology and any additional tables or appendices. Much of it can usually be checked against the charts and tables I’ve already verified. For the rest, I will refer back to the data source. Sometimes, the author will reference a previous Pew Research Center report or outside research. In that case, I’ll read enough of the referenced text to determine if they’ve accurately summarized it, pulled a number from it or quoted it. I will also check any references to current events or historical facts by checking dates, claims, names and other basic facts against a reputable source.
One of the most challenging aspects of number checking is verifying the author’s claims and characterizations of the numbers. I run the appropriate statistical tests to determine whether, for example, 51% is a statistically significant majority (in survey data, it’s usually not), whether women are more likely than men to say there are too few women in high political office (they are), or whether the long-term decline in unauthorized immigration from Mexico is really a decline (it is).
Since probability-based survey estimates are associated with a margin of error, we can’t confidently say that a change over time is statistically significant if the margins of error for the two figures overlap. An increase or decrease of only a couple of percentage points usually does not meet this bar. We take our language seriously, and any use of the words “plurality,” “majority,” “minority,” “most,” “increase” and “decrease” (along with some others) must be rigorously checked for statistical significance.
In cases where we don’t have a hard-and-fast institutional rule, number checkers sometimes must exercise their own judgment. In a situation where 54% of Americans approve of a policy and 46% disapprove, for instance, should this be characterized as majority approval? Or are Americans about evenly divided on the issue in question, even though the difference may be statistically significant? Context matters, and we try to be as fair as possible.
The number checker also has to pay close attention to other types of language. While authors try to vary their phrasing a little throughout a report to make their text more readable, there’s a balance between accurately portraying the wording that was used in a survey question and using creative language. Consider a question from a 2016 survey of police officers:
Do you think the deaths of African Americans during encounters with police in recent years are isolated incidents or signs of a broader problem between African Americans and the police?
This is a long question, so the authors naturally sought ways to shorten it rather than writing it verbatim dozens of times throughout the report. In an early draft, one of those ways was to refer to the incidents asked about in the survey question as “recent deadly encounters between police and blacks.” While our survey was in the field, however, a black man shot and killed five police officers in Dallas. With that incident in mind, I thought “recent deadly encounters between police and blacks” was not specific enough shorthand since it could also refer to the Dallas shooting — clearly not what the survey question was referring to. We settled on “deaths of blacks during encounters with police in recent years” as an alternative to restating the entire survey question in every reference.
Checking for consistency
After all of the above is done, I look through the material again to check for style and consistency. I’ll catch much of this in my initial number check (and the copy editor will also serve as a backup), but at this stage in the process I like to make sure the whole report is cohesive and matches our internal style guidelines. A lot of this focuses on charts. For example: Are we using the same wording in the sub-headline and labels from chart to chart when they’re describing the same things? In opposing bar charts, do we consistently have the “oppose” numbers on the left side and the “favor” numbers on the right side? Are we using the same color scheme to represent men and women throughout? Is the language for notes and sources the same throughout? Other things we look for in the text include whether numbers are consistently rounded to the same decimal place.
Discussing changes with the author or authors
After I’m done with my number check, I usually take my written comments and translate them into a marked-up version in Microsoft Word. This gives me a second chance to review my comments and think about how best to implement them. Then I send the document to the author or authors so they can review my edits, double check any changes I’ve made, answer any questions that arose, accept or reject my edits and comments (with an explanation for anything rejected), and send me back a clean copy. Then I go through my hard copy and check off that all my edits were made correctly. If anything I felt strongly about didn’t get changed, the author and I will have a conversation to come to a compromise or explain our respective reasoning.
Seeing each piece of research through to publication
The number checking doesn’t end there! The number checker will follow along with the publication process until the research they checked is publicly released. After a number check is complete, the report or blog post goes to one of Pew Research Center’s copy editors, who take their own pass through it to improve clarity and ensure all style guidelines are followed. When the copy edit is done, both the number checker and the author review whatever changes the copy editor made to make sure no numbers (or the meaning of particular phrases or sentences) have inadvertently changed.
Once the report or blog post is loaded into our content management system ahead of publication, I’ll review it once again to make sure no paragraphs were inadvertently dropped, all hyperlinks work, and all charts are placed in the appropriate spots in the text. Sometimes colleagues see the final draft and have feedback for the author, in which case I always review any post-number check changes. Finally, I’ll check any associated materials, such as press releases, interactives and tweets that will be sent from any of our institutional accounts, particularly since tweets are highly visible distillations of our research.